What's new at openJII this Spring
A tour of what's new in openJII: Workbooks for building your measurements steps, easy charts and dashboards, and a rebuilt mobile app for in the field.

This spring has been a exciting season for openJII. We’ve introduced a new way to build your measurements, improved tools for charting and sharing your results, a fresher feel to the app, and rebuilt mobile companion for the field. In this update, we’ll walk you through the key changes and show how they can support your research.
You'll find dozens of improvements across the platform, but they come down to a few simple ideas: make openJII quicker to get around, give you real tools to explore your own data, and let you build and reuse your measurement steps with confidence.
1. Workbooks: Build your measurements like a recipe
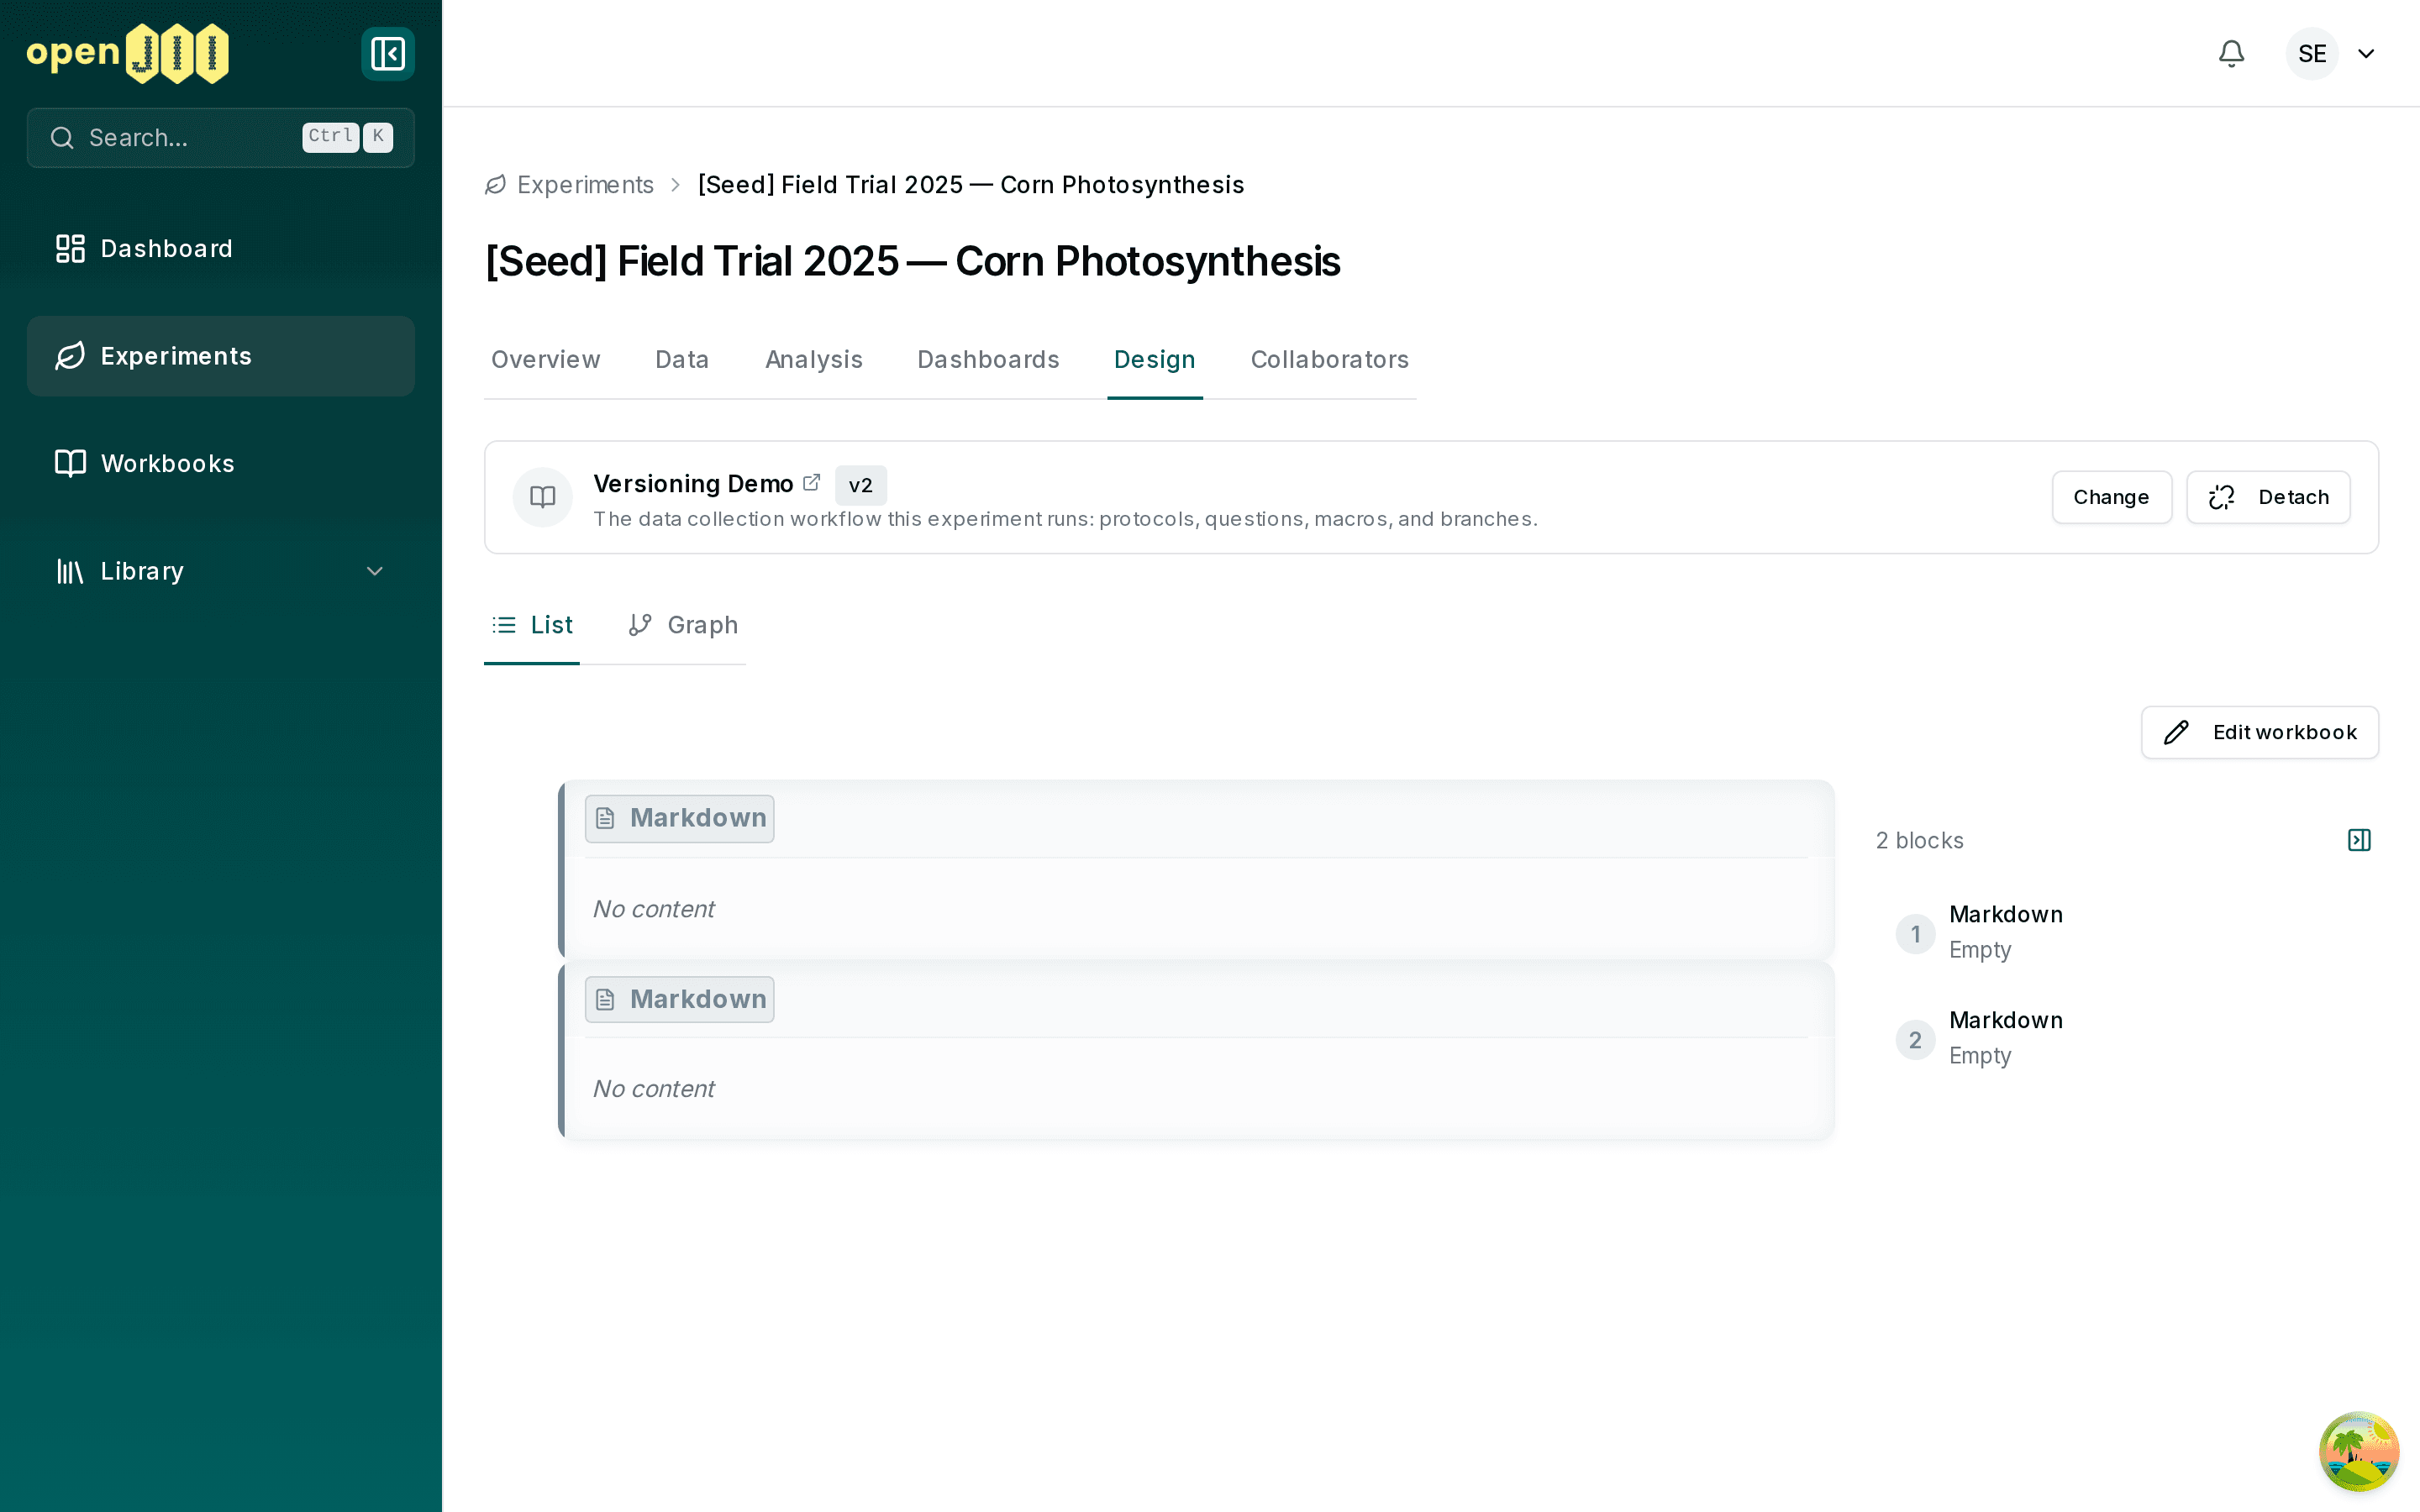
The biggest new feature is Workbooks — a single place to describe every step of a measurement, a bit like a recipe.
You build a workbook using simple blocks:
Markdown blocks let you jot down instructions or context.
Protocol blocks set what the device measures.
Macro blocks tidy up or transform your data.
Question blocks let you record notes and observations in the field.
Branch blocks add “if this, then that” steps.
Every workbook can be saved as a new version, so you always know exactly which steps produced a given result — really handy when you come back to a study months later.
You can attach a workbook to an experiment so everyone collecting data follows the same steps, and lock an experiment to a specific version until you're ready to update.
The Workbooks page shows all your workbooks, including which experiments are using each one.
2. Visualize your data within openJII
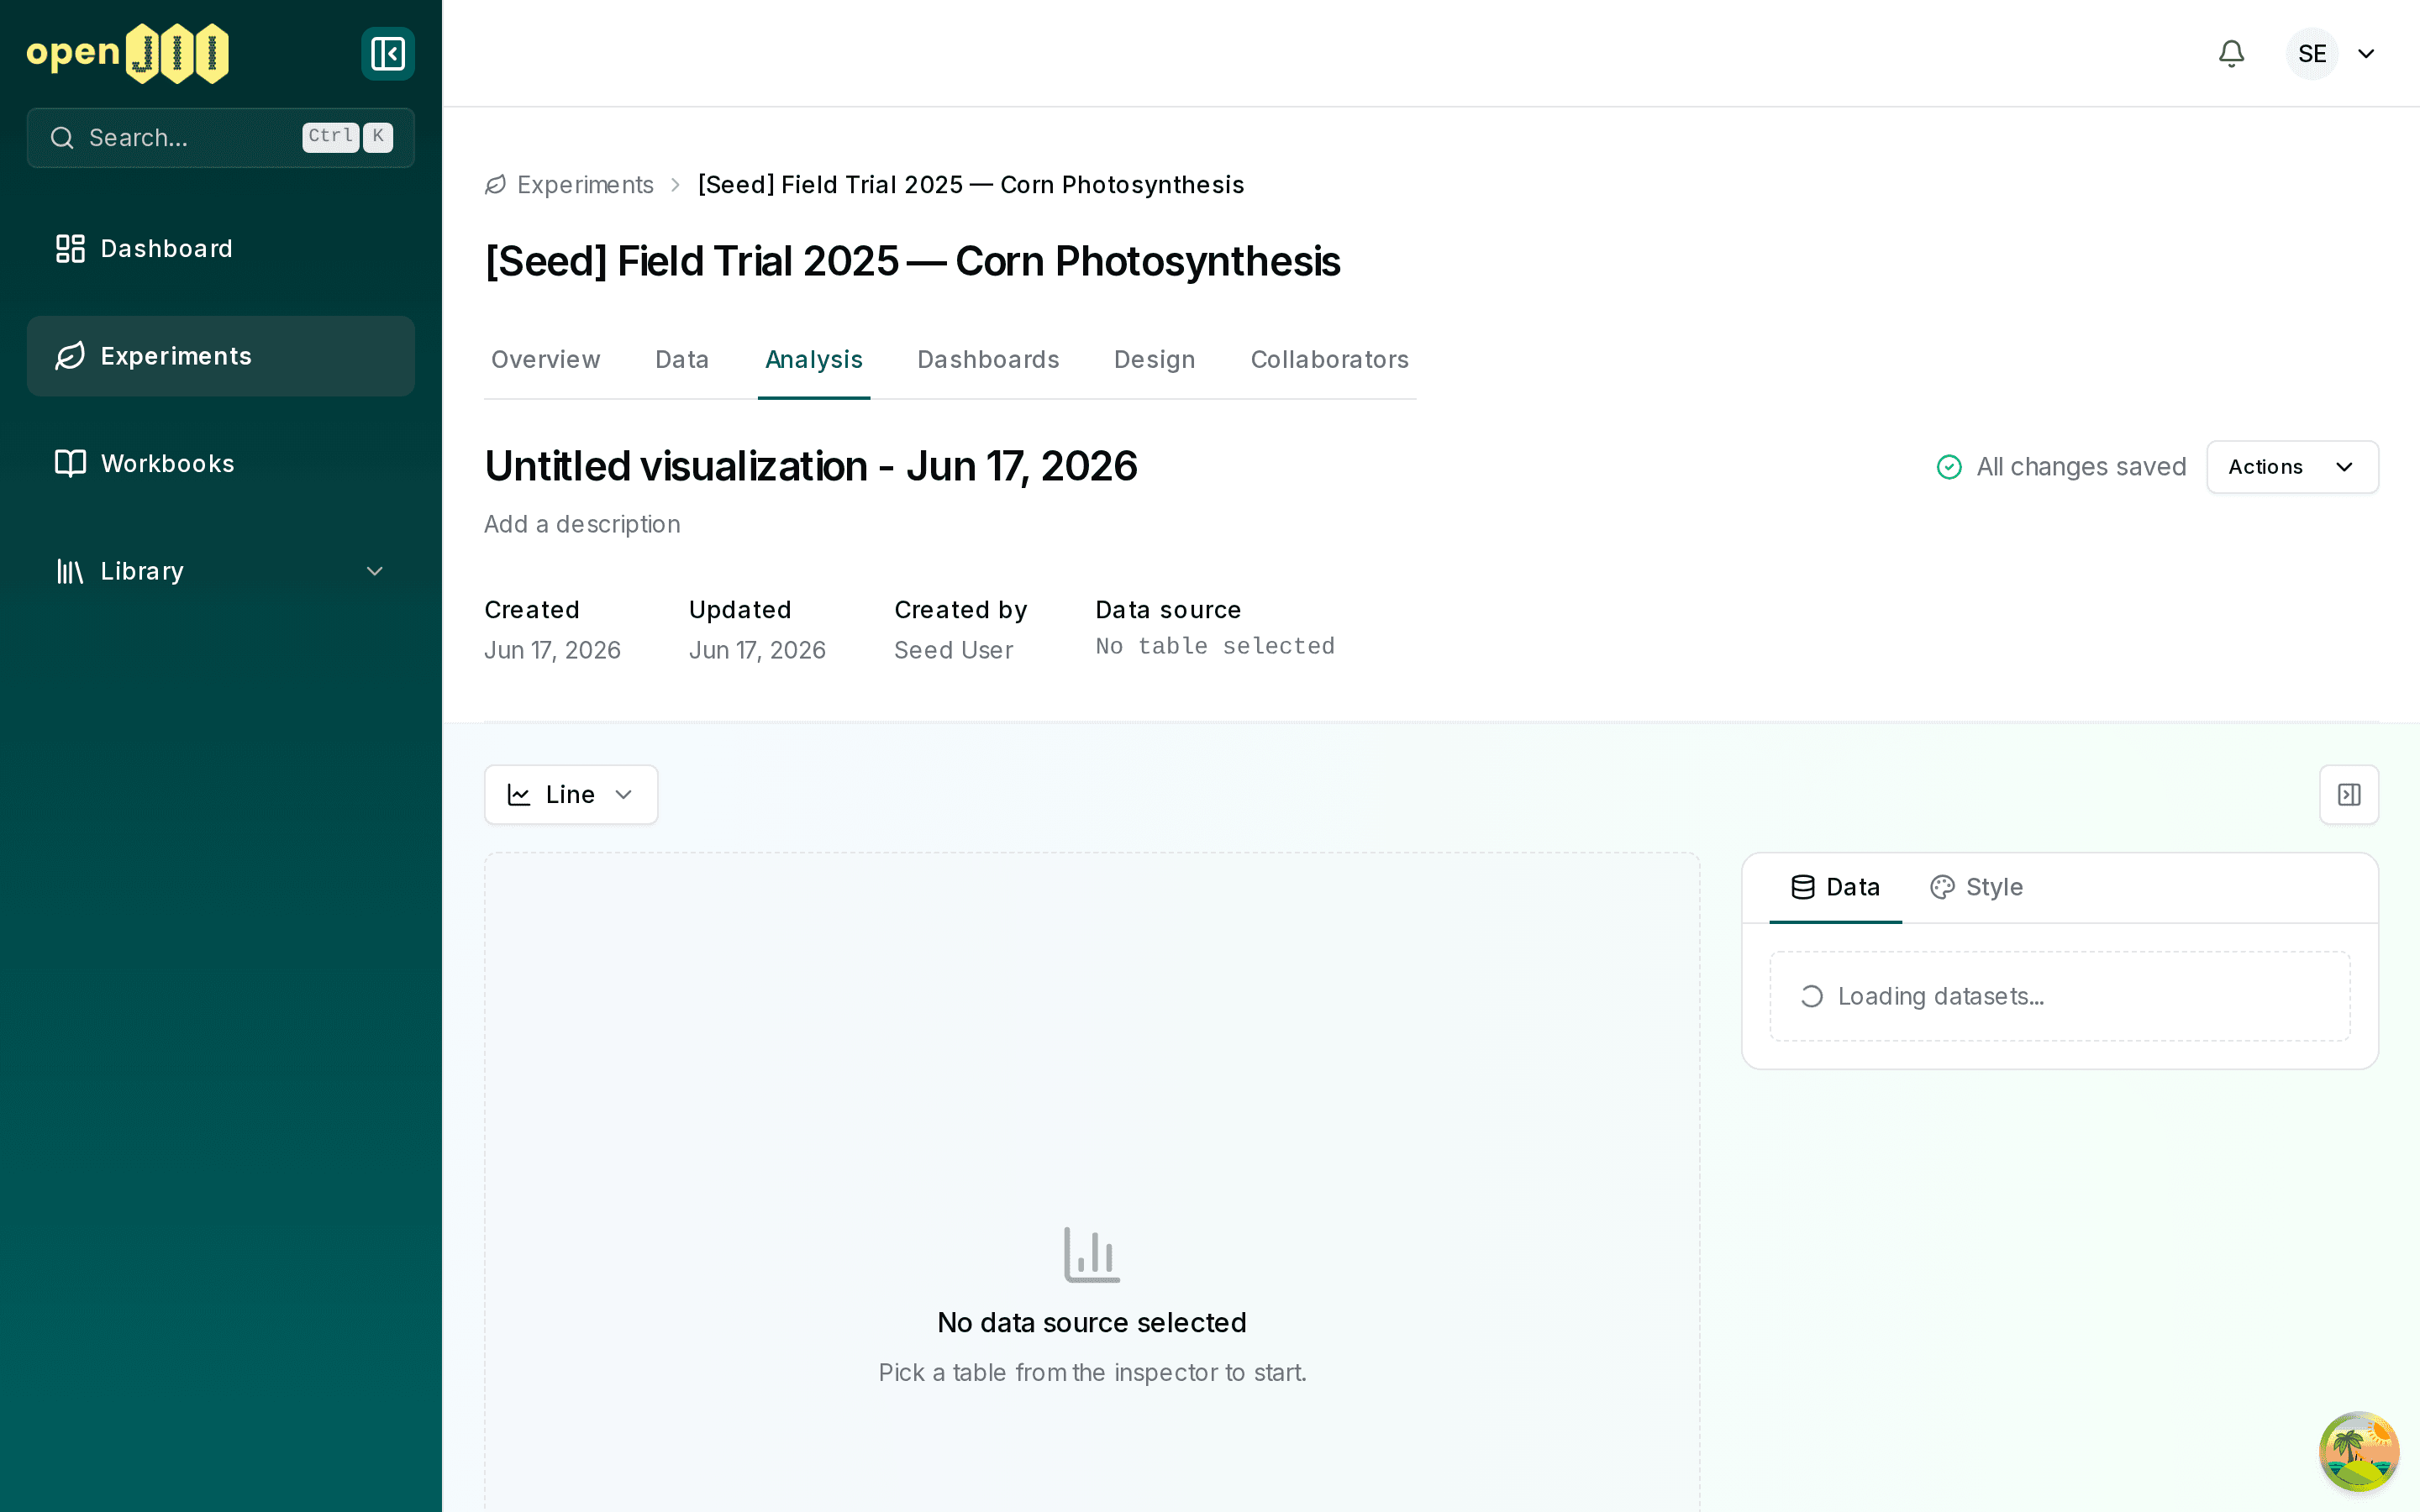
You no longer need to export your data somewhere else to make a chart.
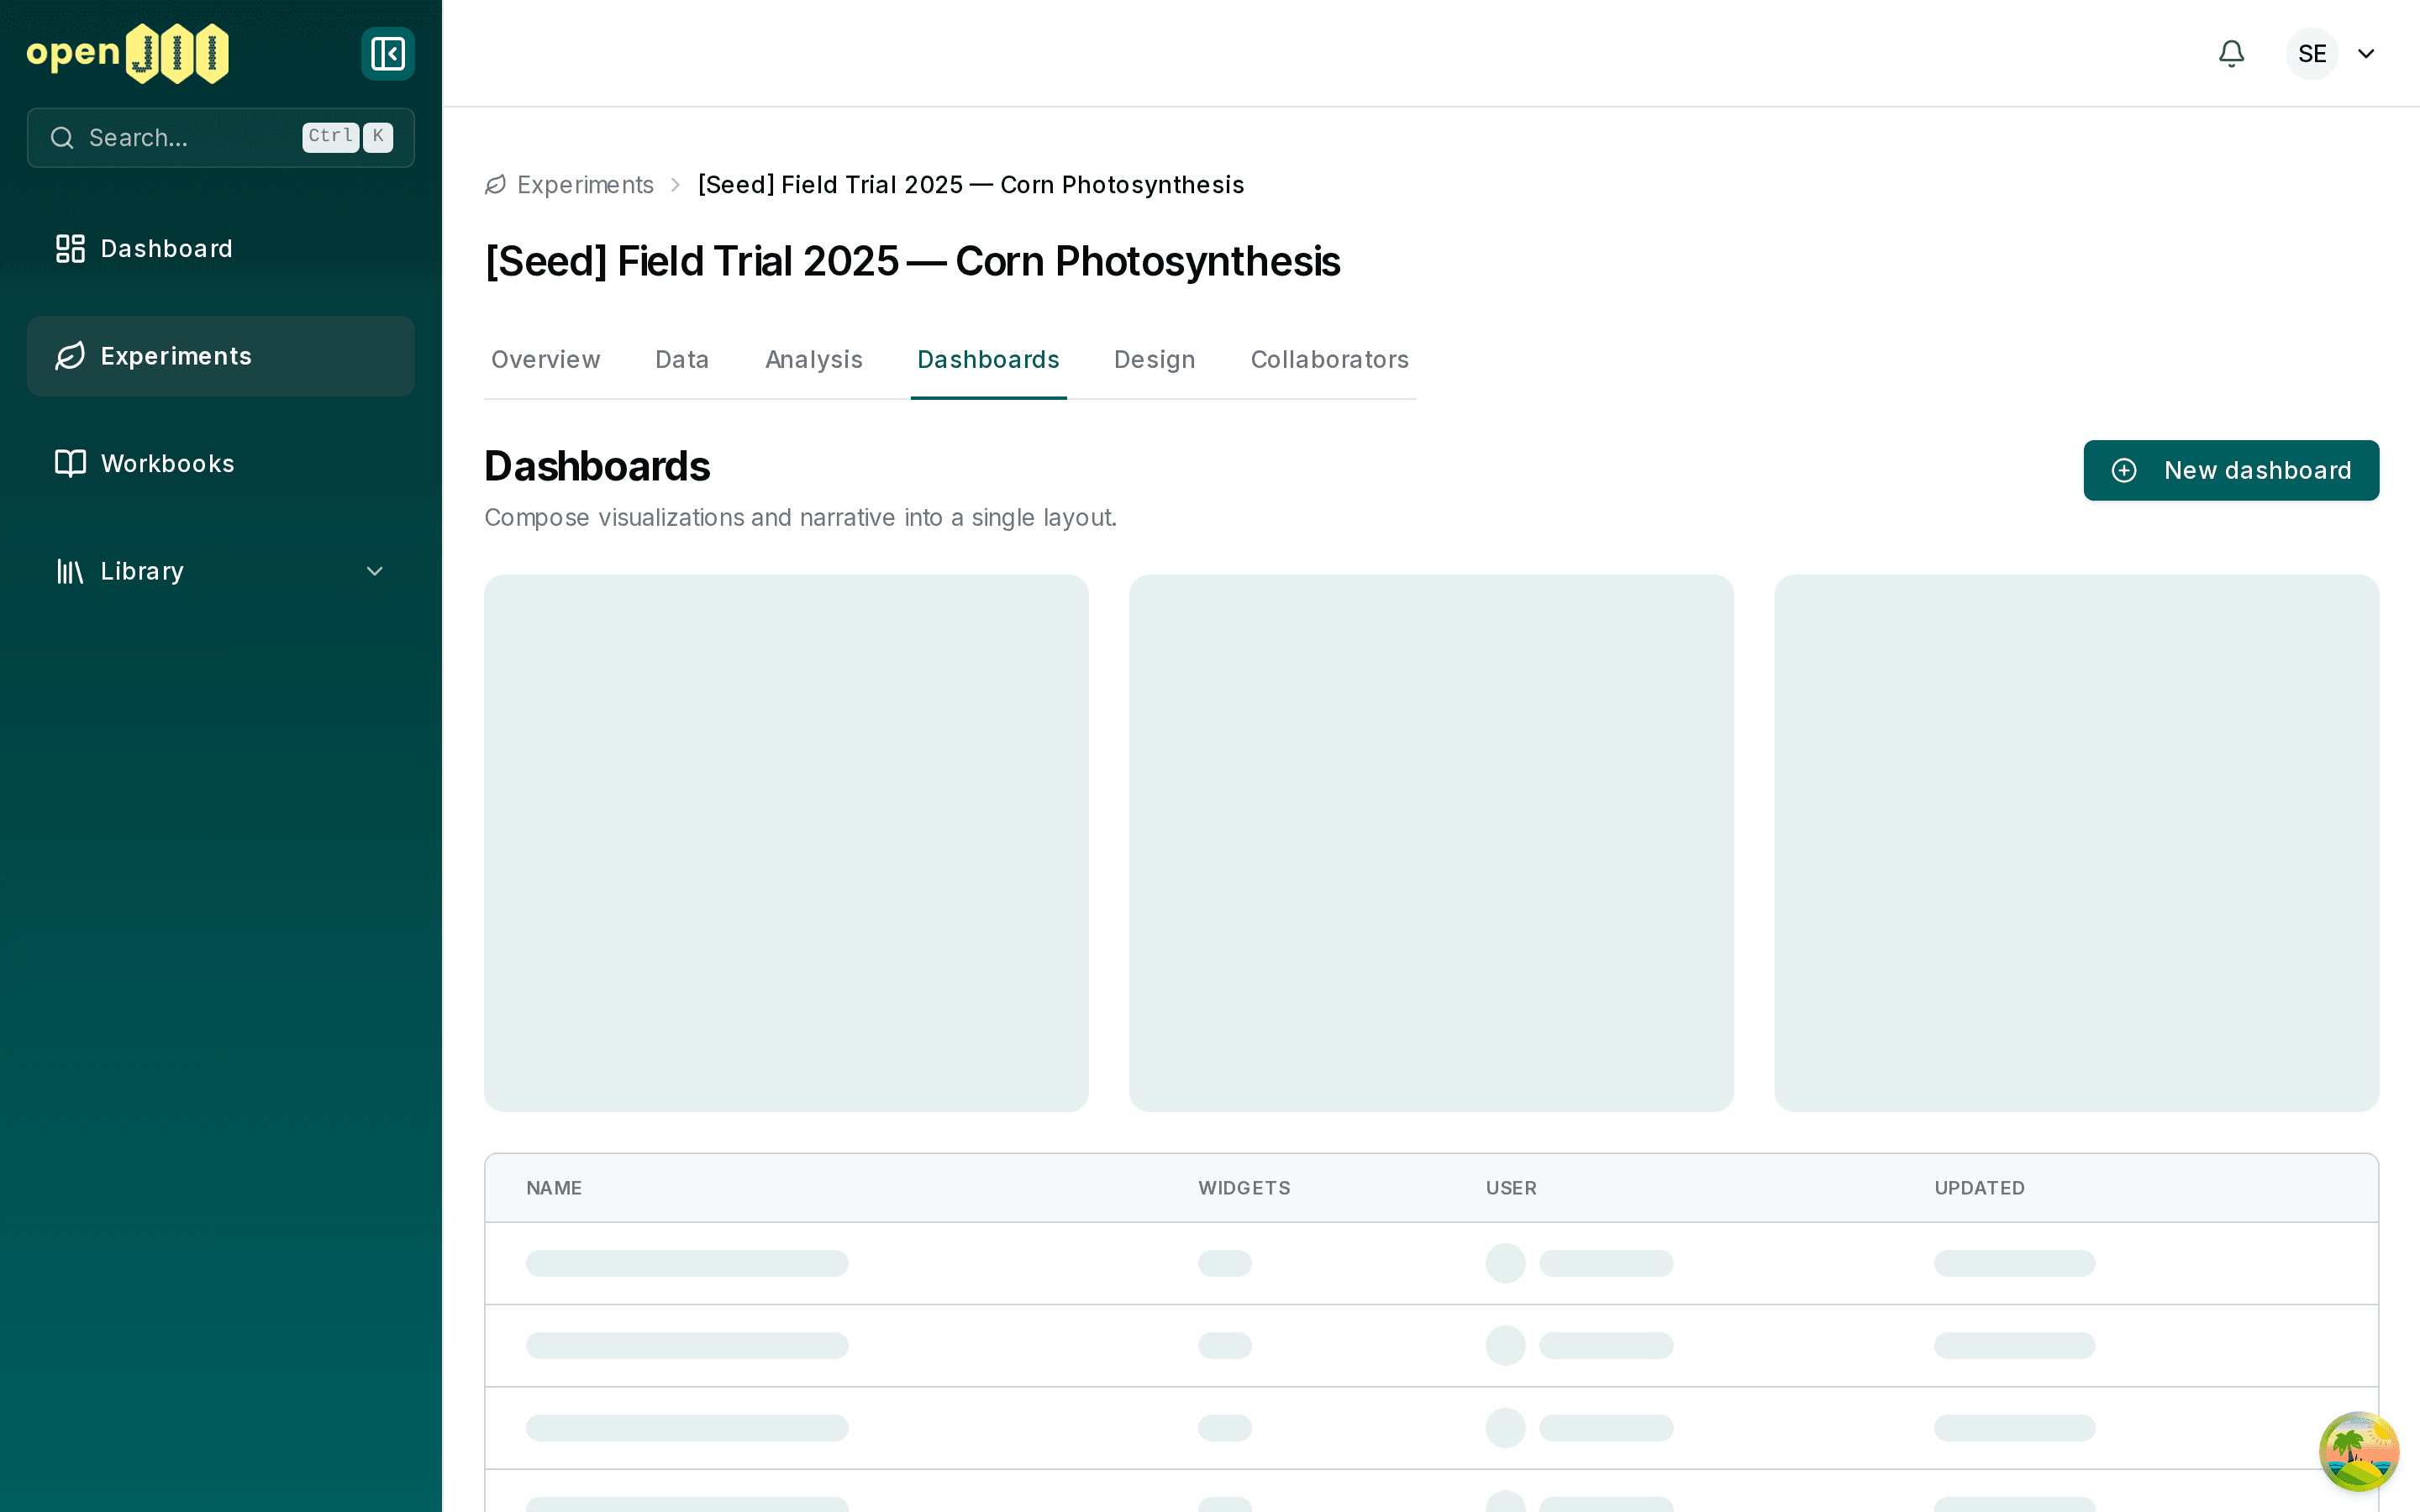
Just pick what you'd like to look at, choose a chart style, and it appears — while your work saves automatically as you go. There's a wide range of chart types, from simple bars, lines and pie charts to box plots, histograms and heatmaps. You can filter to focus on only the readings you care about, and group several charts together into a dashboard to tell the whole story on one page.
3. Get around faster
We've made the platform quicker to move through.
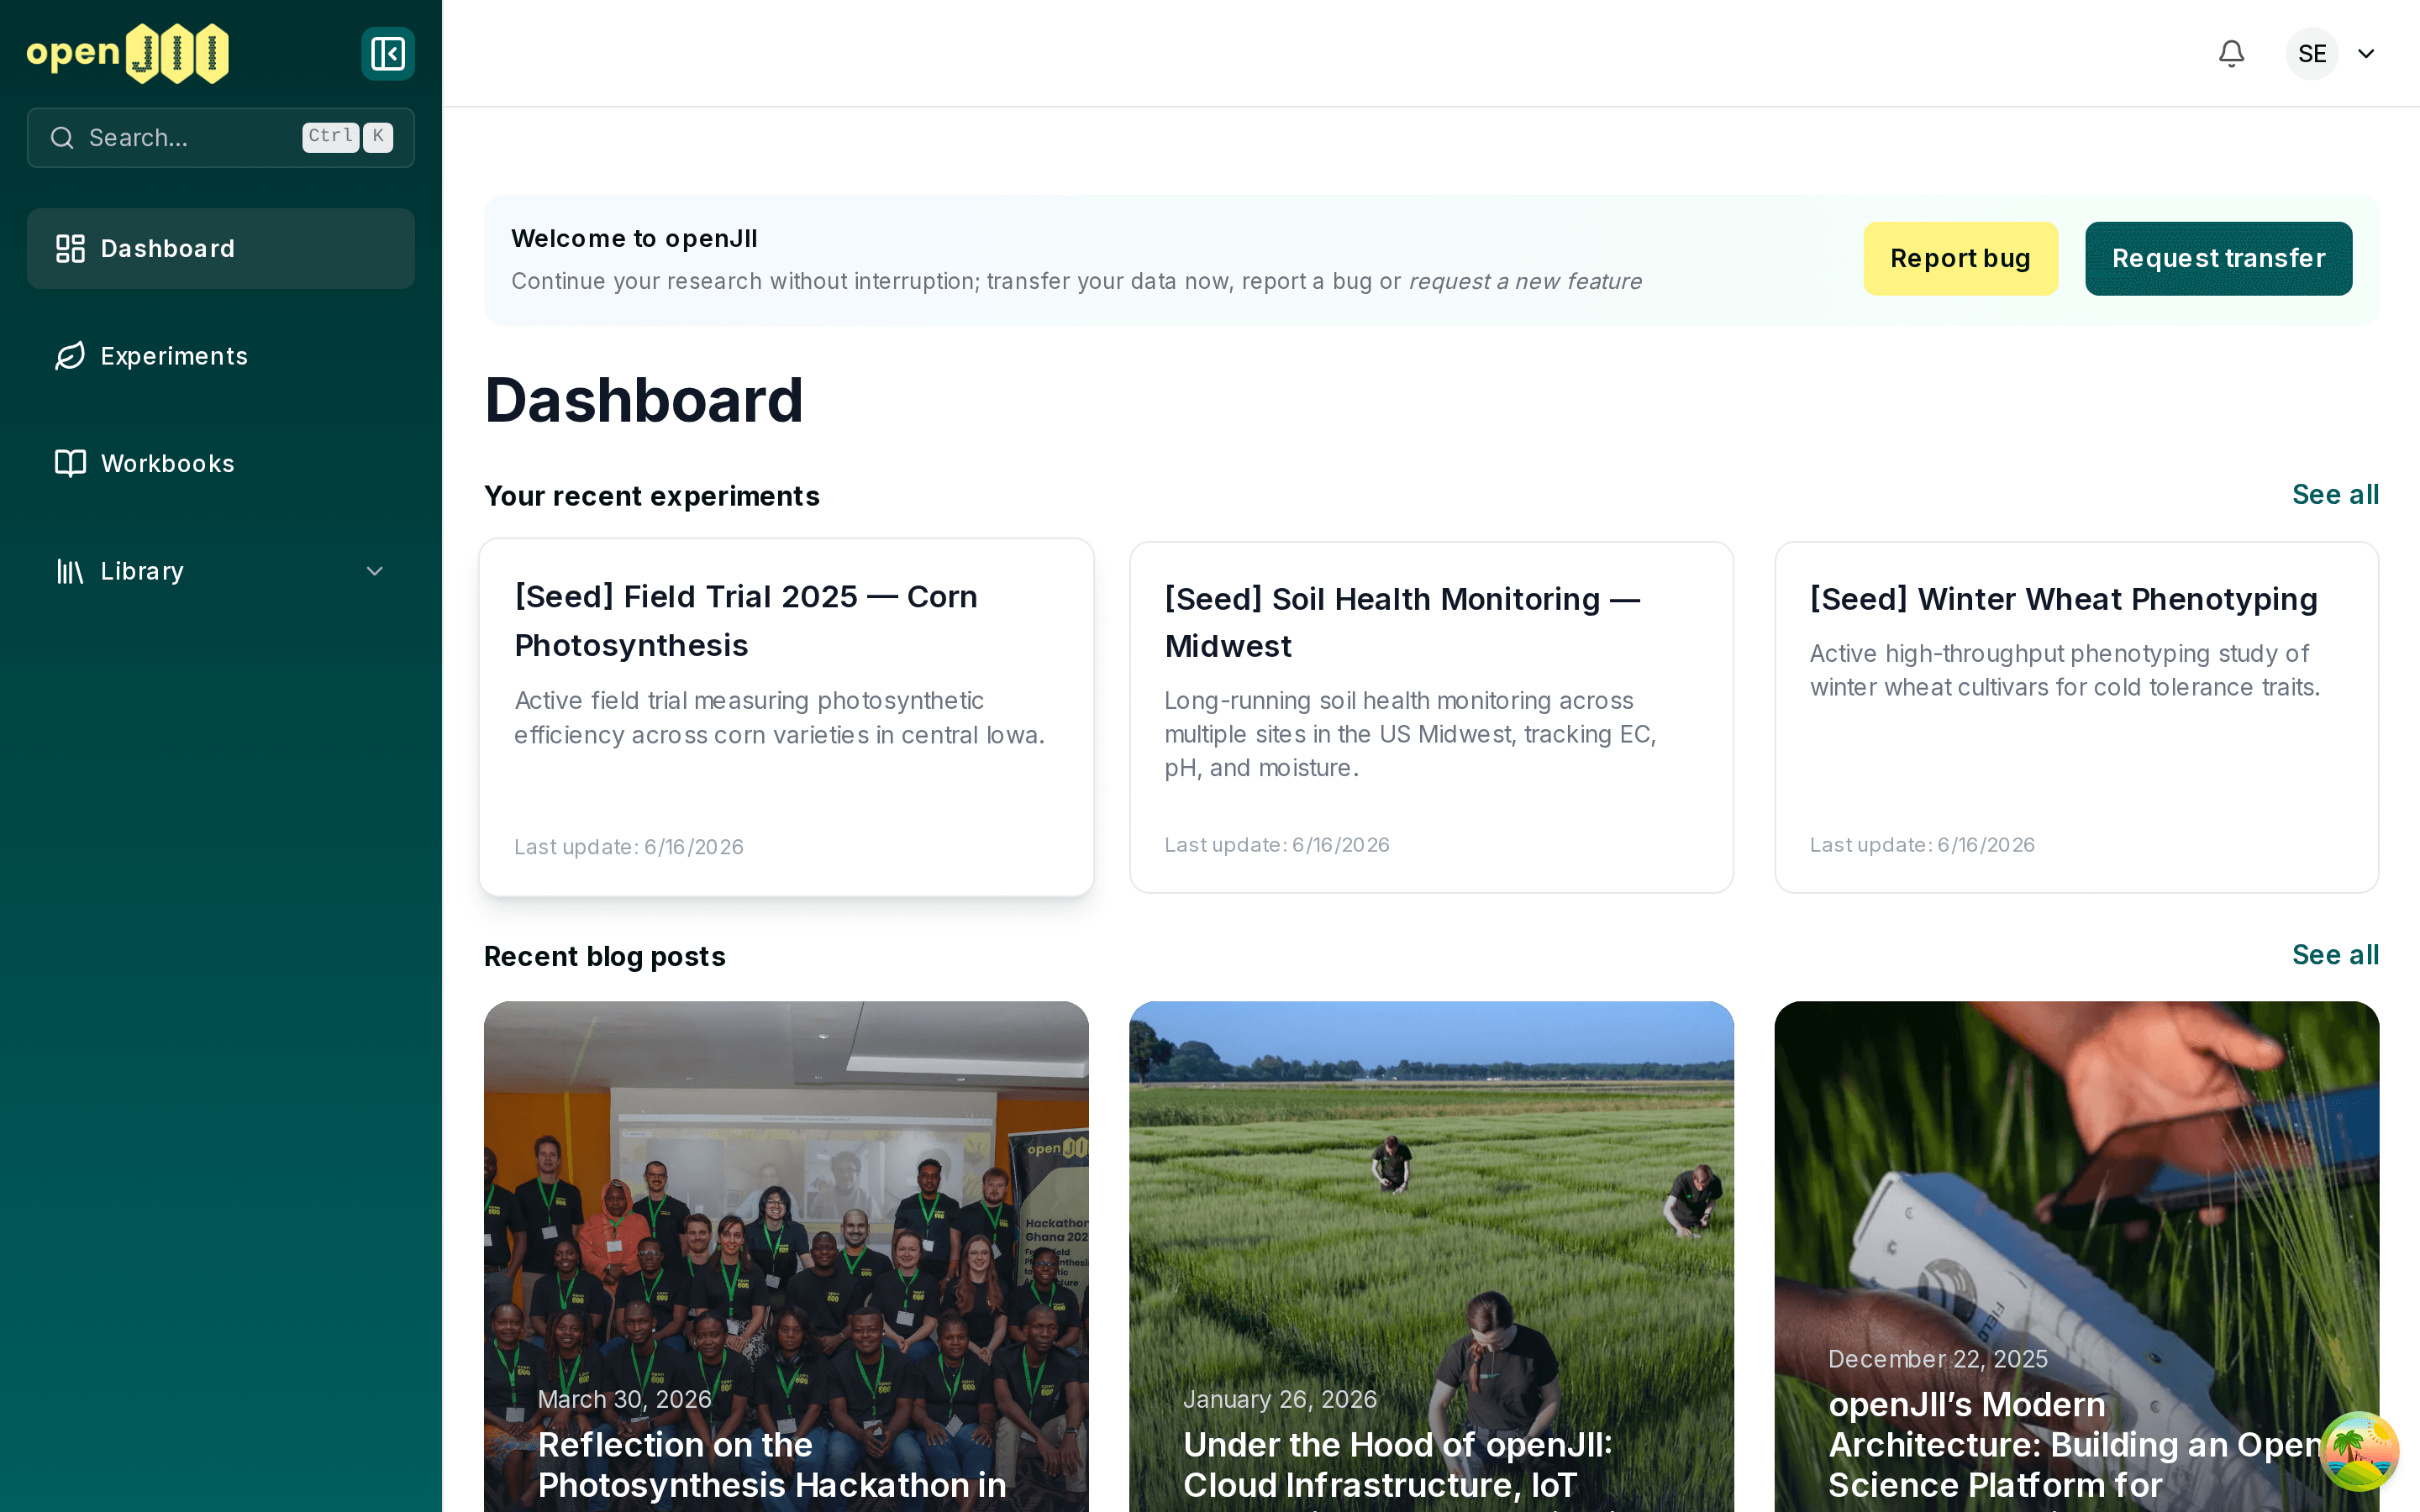
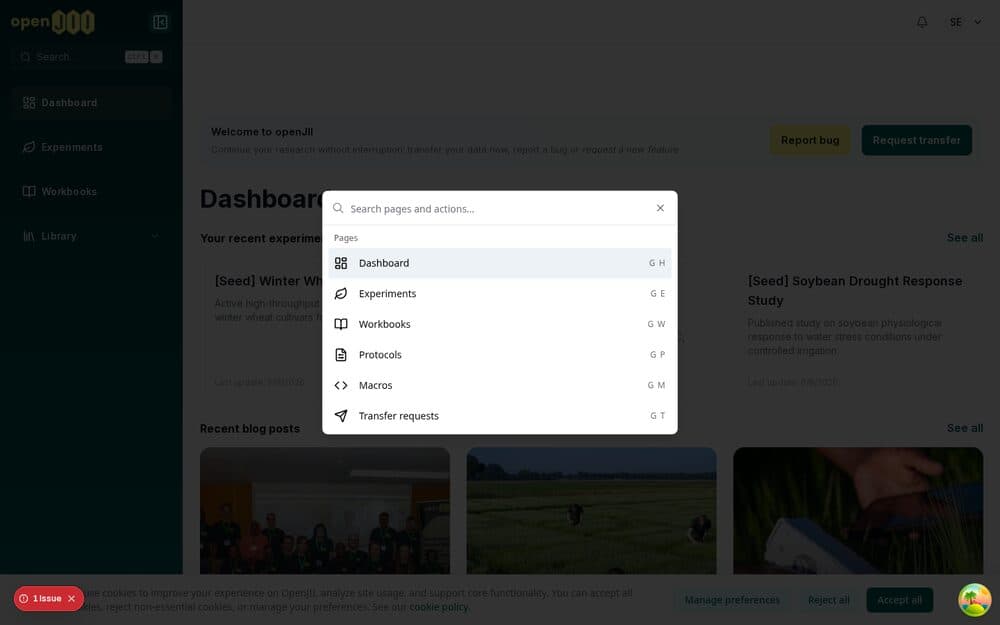
A quick-search bar (press Ctrl or ⌘ + K) jumps straight to any page.
Keyboard shortcuts for the things you do most.
A sidebar you can tuck away when you want to focus.
An activity area that tells you when things like data exports are ready.
4. A fresh mobile app for the field
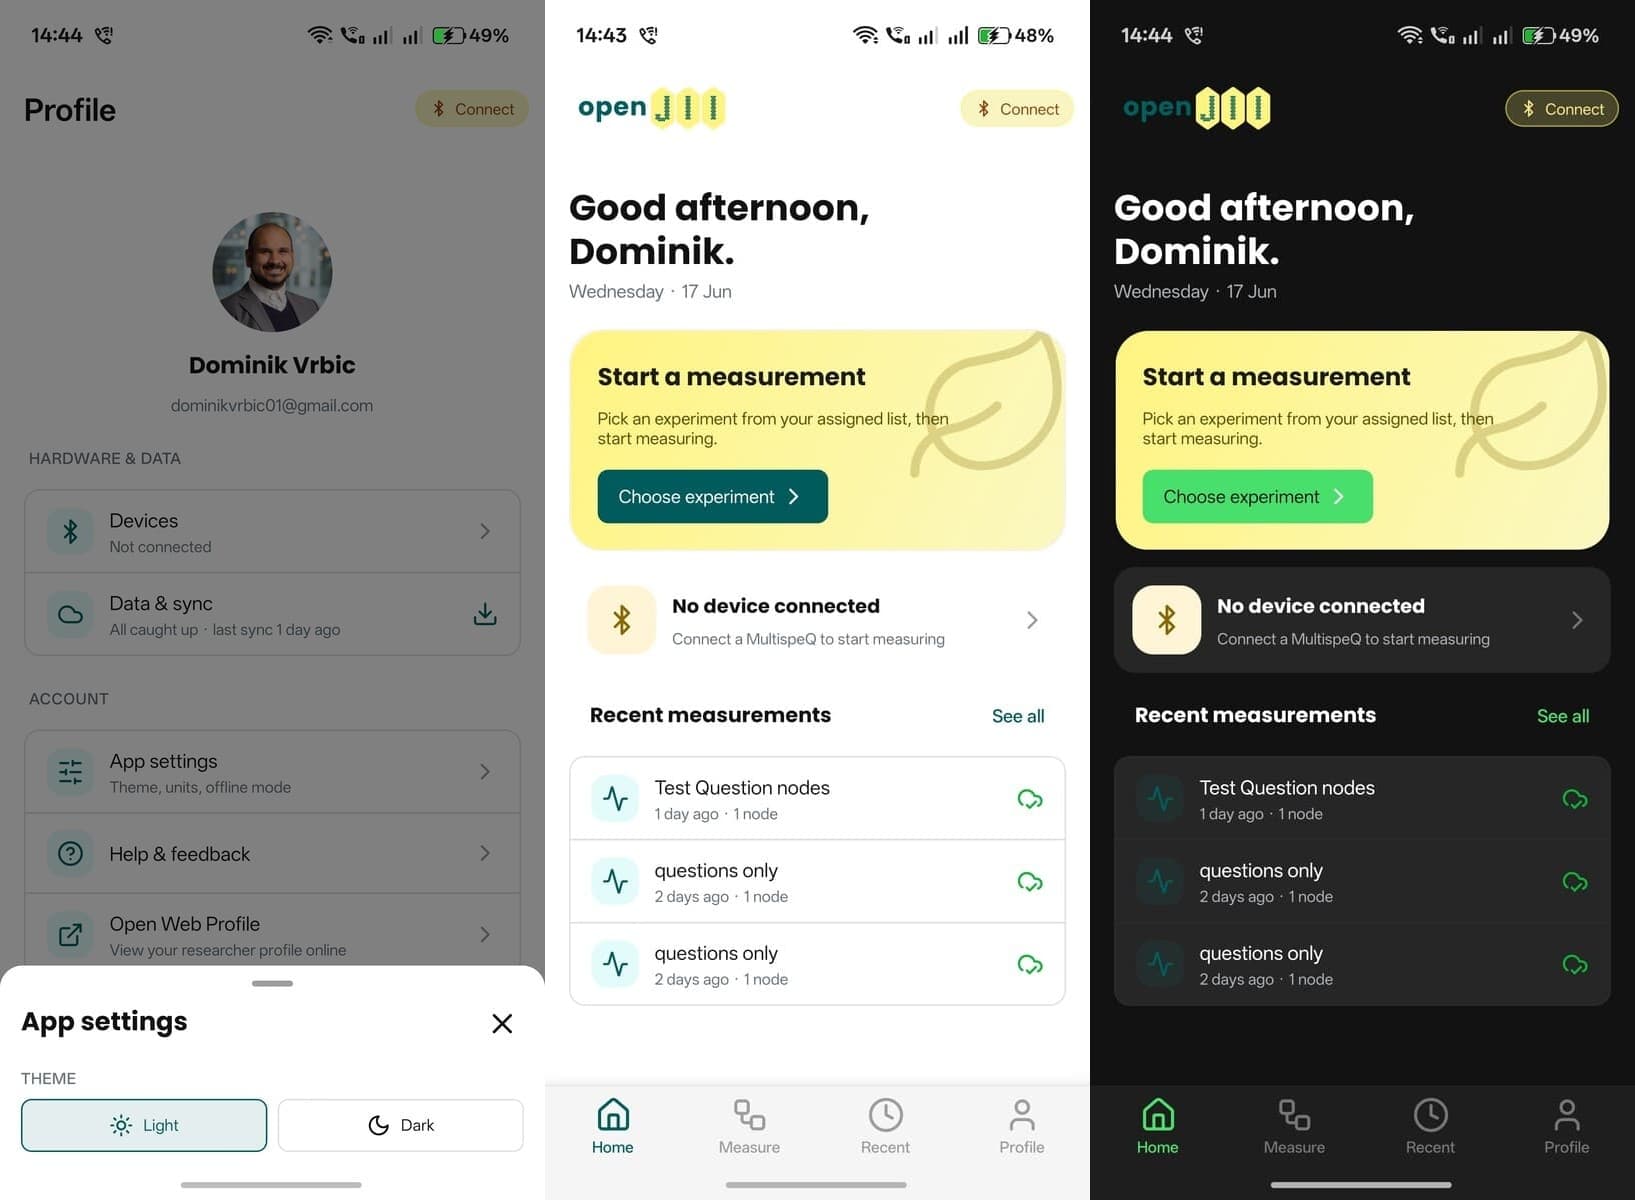
The mobile app you take out into the field has been redesigned from top to bottom.
Choose light or dark mode from your profile.
The app updates itself quietly in the background, so you're always on the latest version.
Clear upload progress so you always know which measurements are safely saved.
Finding your MultispeQ is easier, nearby devices are listed clearly so you can pick the right one.
It works in landscape mode and can be used in more languages.
5. Steadier and safer platform behind the scenes
A lot of the work this spring was under the hood, to make everyday use more dependable:
Your measurements upload more reliably, even large ones, and everything is safely archived.
More secure connections between the app and your devices.
New tools let us fix up older records when something needs correcting.
You can choose to keep contributors anonymous in shared data and exports.
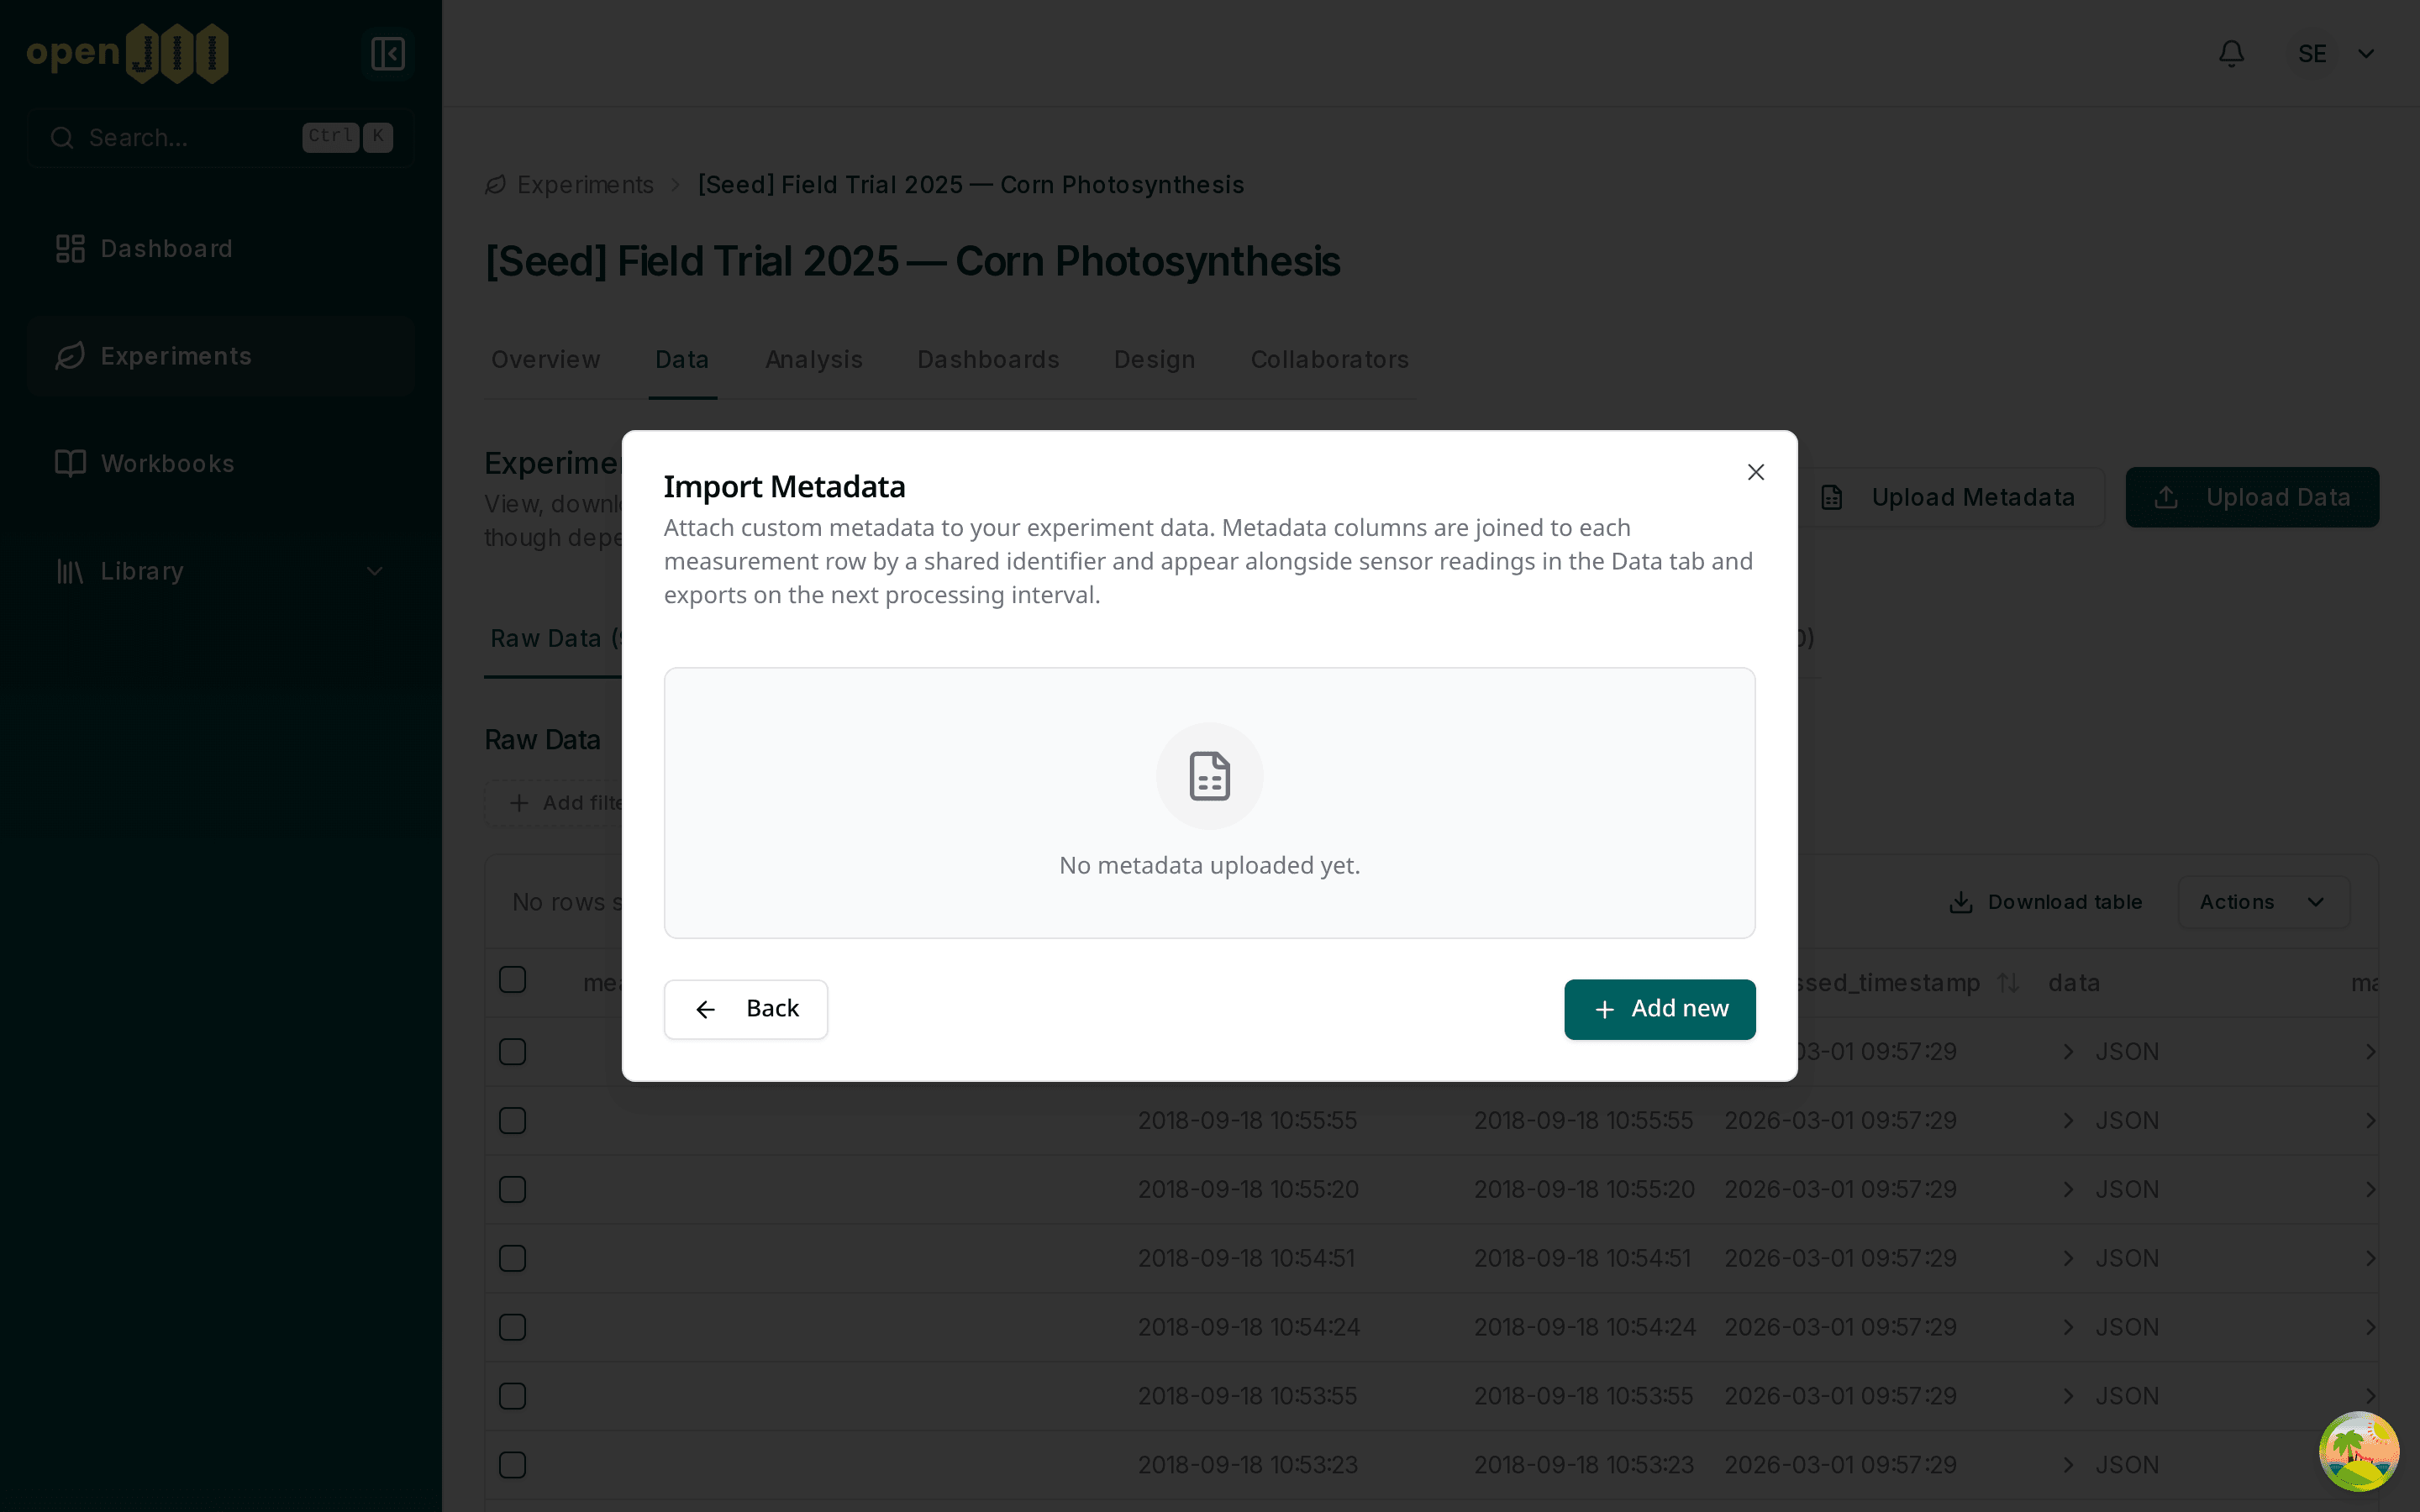
Adding data is simpler too, with a easier way to upload your measurements and any extra information (metadata) that goes with them.
6. Easier to share and manage your projects
Finally, working together got smoother:
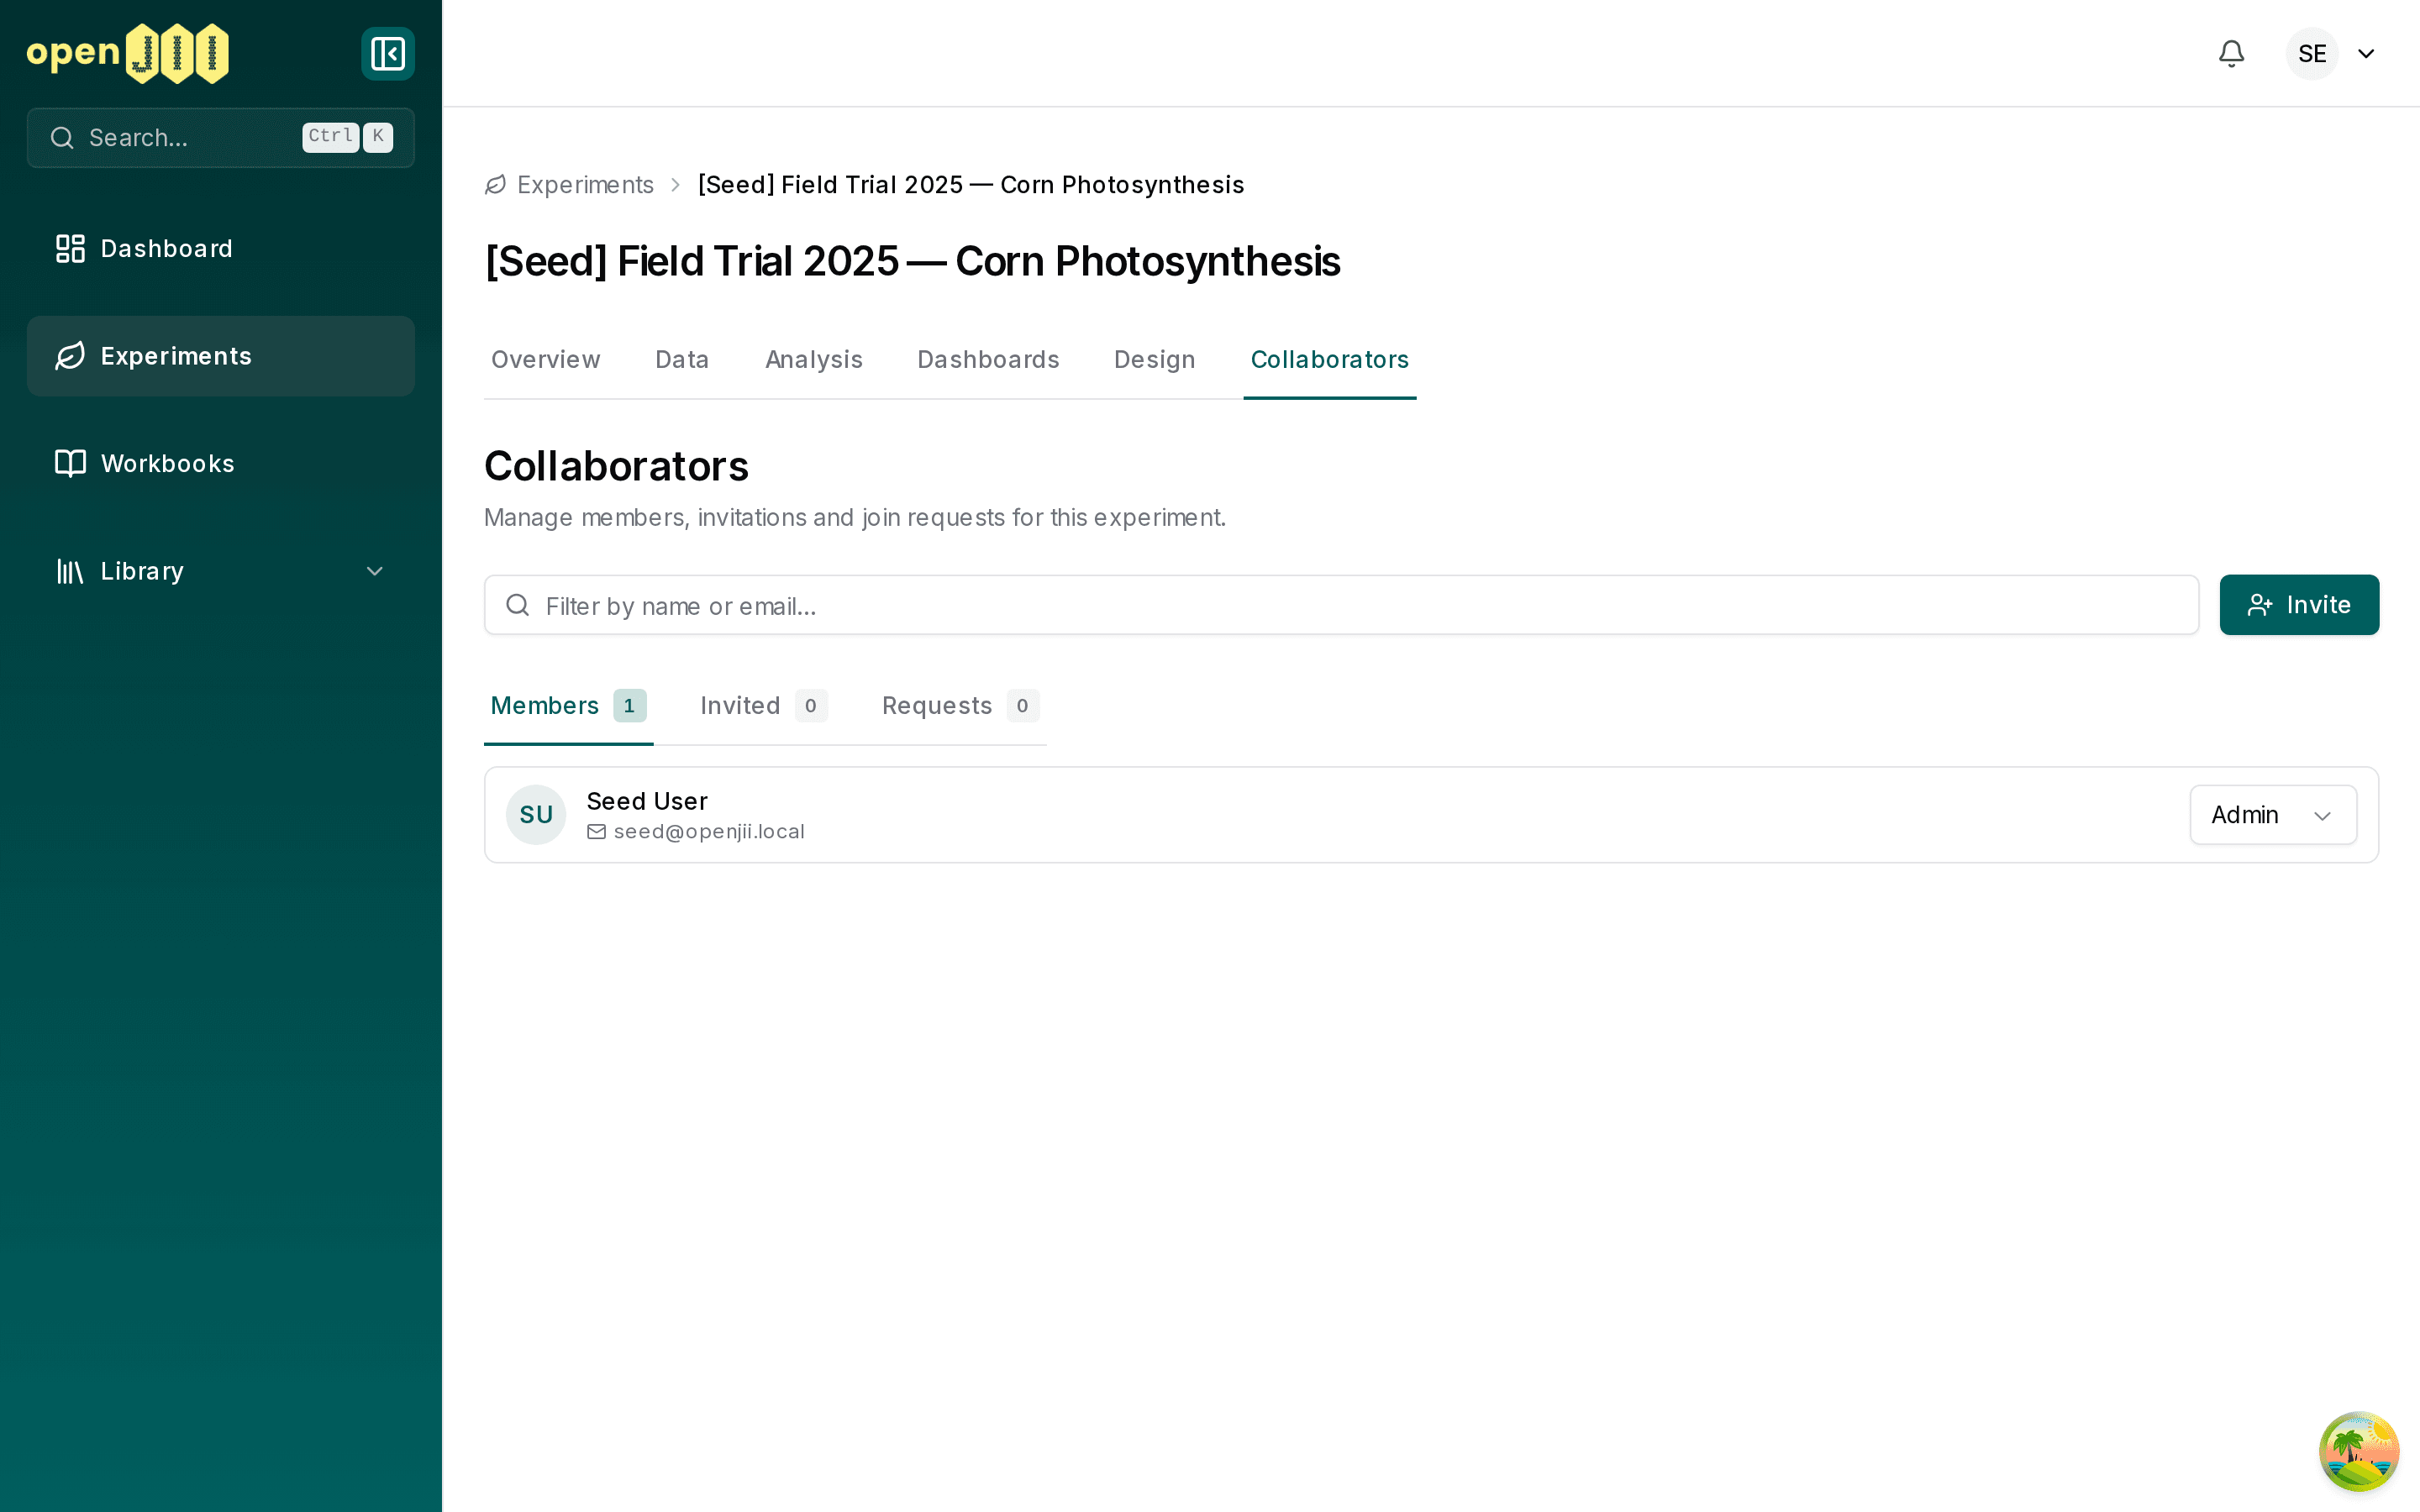
Ask to join an experiment, and project owners can manage who's involved and approve requests.
New settings let you decide who can see your data, and when.
You can move a whole project to another account (its experiments, protocols, and macros move together) and track it in a transfer-request history.
Emails and in-app notifications you receive have been redesigned.
Give it a try
Everything here is ready for you today. Open a workbook, make a chart from your latest results, and press Ctrl/⌘ + K to find your way around. We'd love to hear what you think, please let us know!