Dashboards, data uploads & a new What's New feed
Everything on main is now live: the complete visualization and dashboard suite, fully generalized data uploads (CSV, Parquet, JSON, or Ambyte), a new in-app What's New feed powering this public changelog, and the mobile app current at v2.3.0.
Everything on main is now live. The headline is data exploration, end to end: the visualization and dashboard suite is complete and data uploads are fully generalized, so you can bring in data, chart it, and present results without ever leaving openJII. A new in-app What's New feed is what powers this changelog, and on mobile the app is current at v2.3.0.
Visualization & dashboards

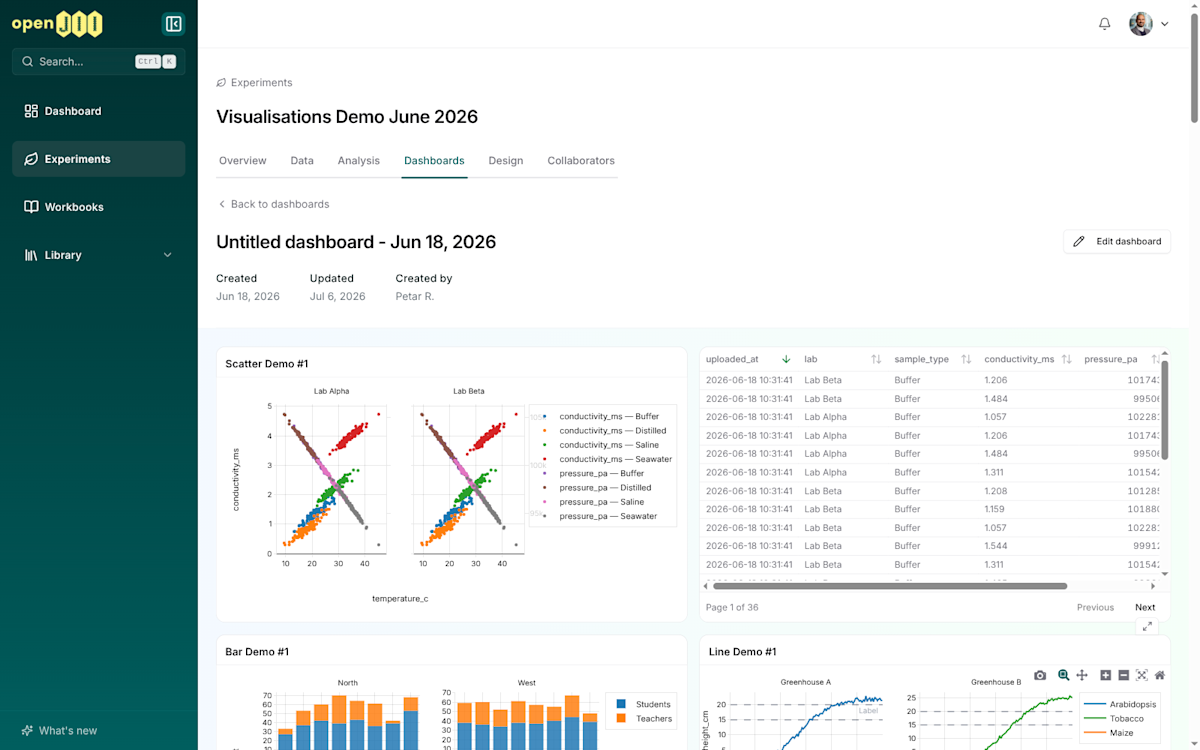
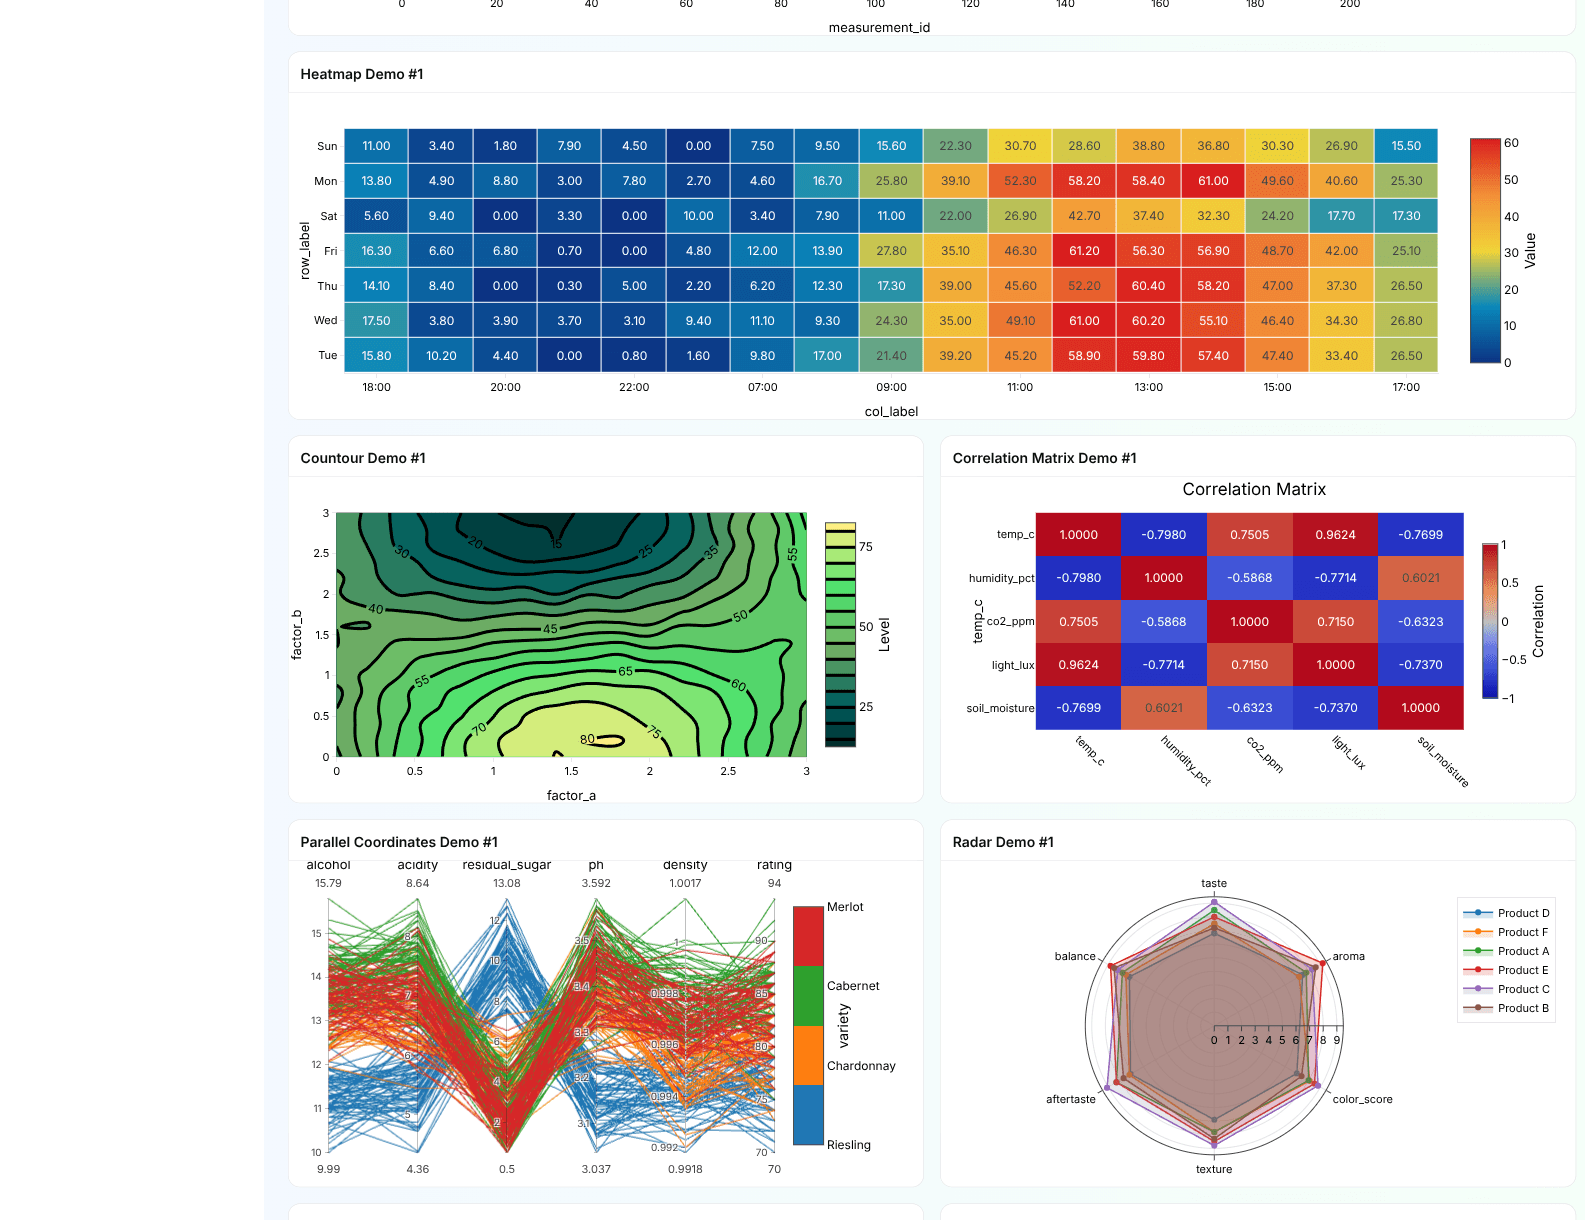
Every chart family: Basic (area, bar, bubble, dot, lollipop, pie), Statistical (histogram, box, violin, density, ridge), and Scientific (heatmap, contour, correlation matrix), plus specialized charts: polar, wind rose, radar, ternary, alluvial, parallel-coordinates, and carpet.
Dashboards: compose visualizations into multi-chart layouts that combine charts and narrative on one page.
Slice and compare: an operator-aware filter shelf and a per-participant view for classroom experiments.
Raw traces, explorable: a direct answer to the Ghana hackathon finding that raw fluorescence carries more signal than pre-computed parameters.
Generalized data uploads
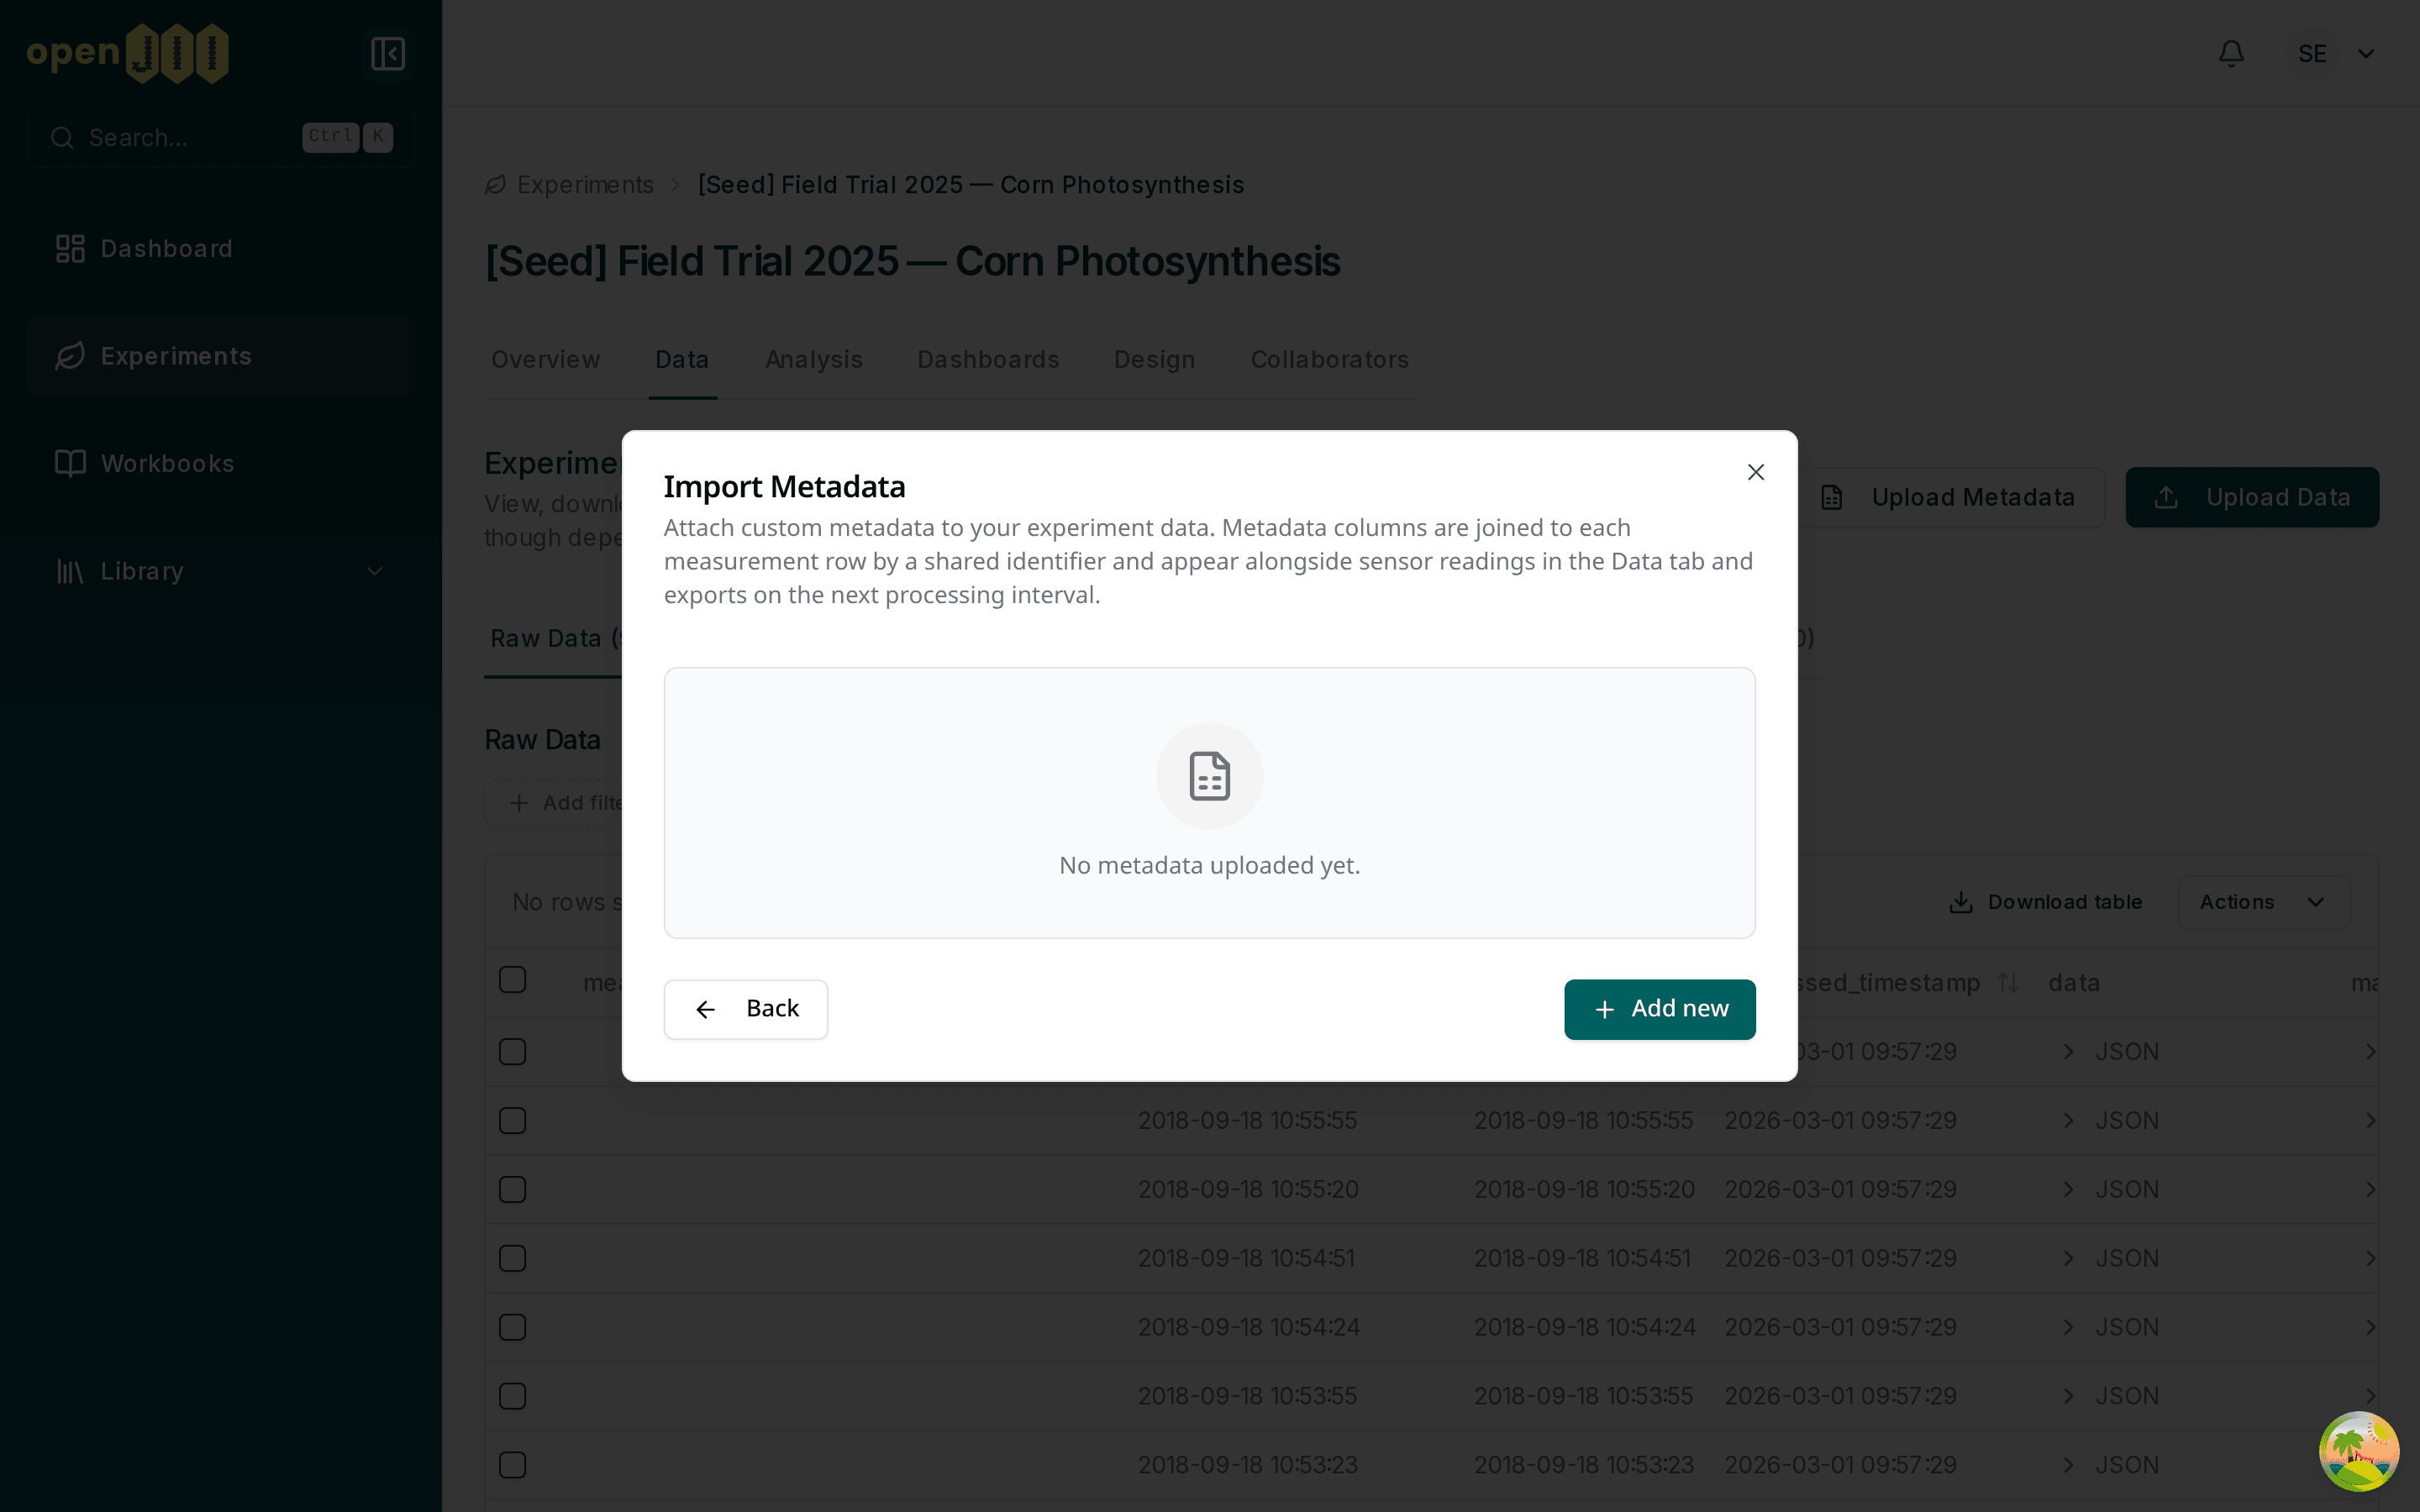
Upload any tabular dataset: the import flow is generalized beyond MultispeQ measurements, so you can bring your own CSV, Parquet, JSON, or Ambyte data and attach it to an experiment.
Redesigned import flow: drag-and-drop file selection, on-selection validation, and a clear append-to-table requirement so every upload lands in the right place.
Hardened end to end: Parquet, JSON, and Ambyte ingestion unblocked, upload history hardened, and internal plumbing columns hidden from your data.
A new What's New feed
In-app What's New: a panel on web and mobile with a per-user unread indicator that stays in sync across your devices.
Public changelog: the /releases page you're reading, with a detail page for every note, now including inline images and video.
Reliability, mobile & polish
Dashboard rendering: chart sizing, WebGL exhaustion, render-loop, and correctness fixes across the renderer so large dashboards stay responsive.
Mobile (v2.3.0): English by default with an in-app language switcher, further crash hardening from PostHog reports, and longer scan timeouts for extended pre-illumination protocols, on top of the branching measurement flows and offline-scan fixes from the late-June cut.
Platform polish: a refreshed public site (logo, footer, spacing) plus a sweep of security and dependency updates.