From the field to your dashboard
Connected devices leave closed testing and open to every account, the Android app reaches 2.65.0 with a fix for oversized measurements, and the platform arrives redesigned with dark mode across its data views, landing page and search.
The last update said device management was in closed testing and that we would announce broader availability separately. This is that announcement. Devices are open to every account now, and the platform they live in has been redesigned.
Connected devices are open to everyone
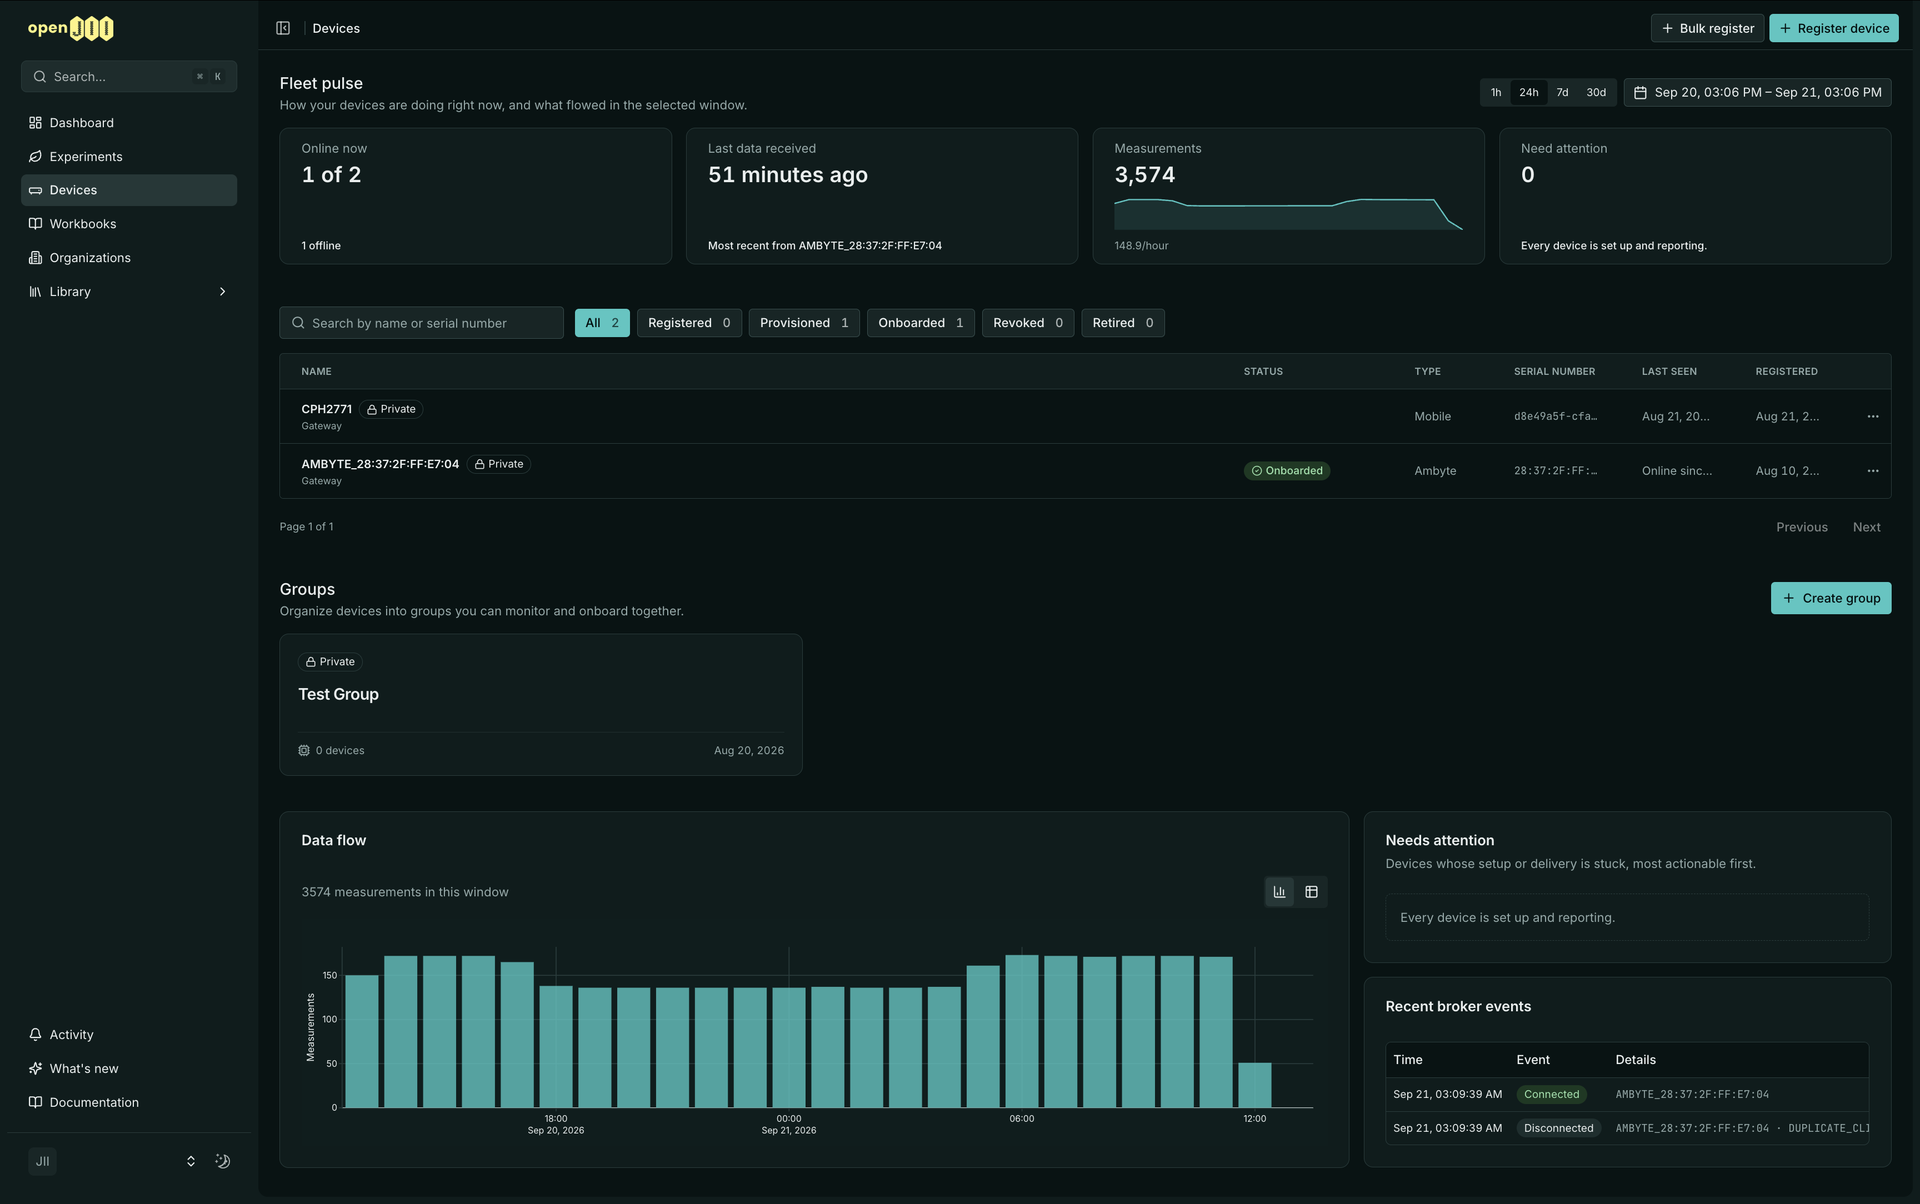
Register a device from the new Devices section, or paste a list of serial numbers and register up to a hundred at once, with every row checked before anything is created.
A device is Registered once it is in the registry, Provisioned once it holds a certificate, and Onboarded once it is bound to an experiment. Revoked means its certificate was withdrawn, and Retired takes it out of service while keeping its record and history.
Issue, rotate and revoke certificates for one device or a whole group at once, and download each bundle at the moment it is created.
Watching what a device does
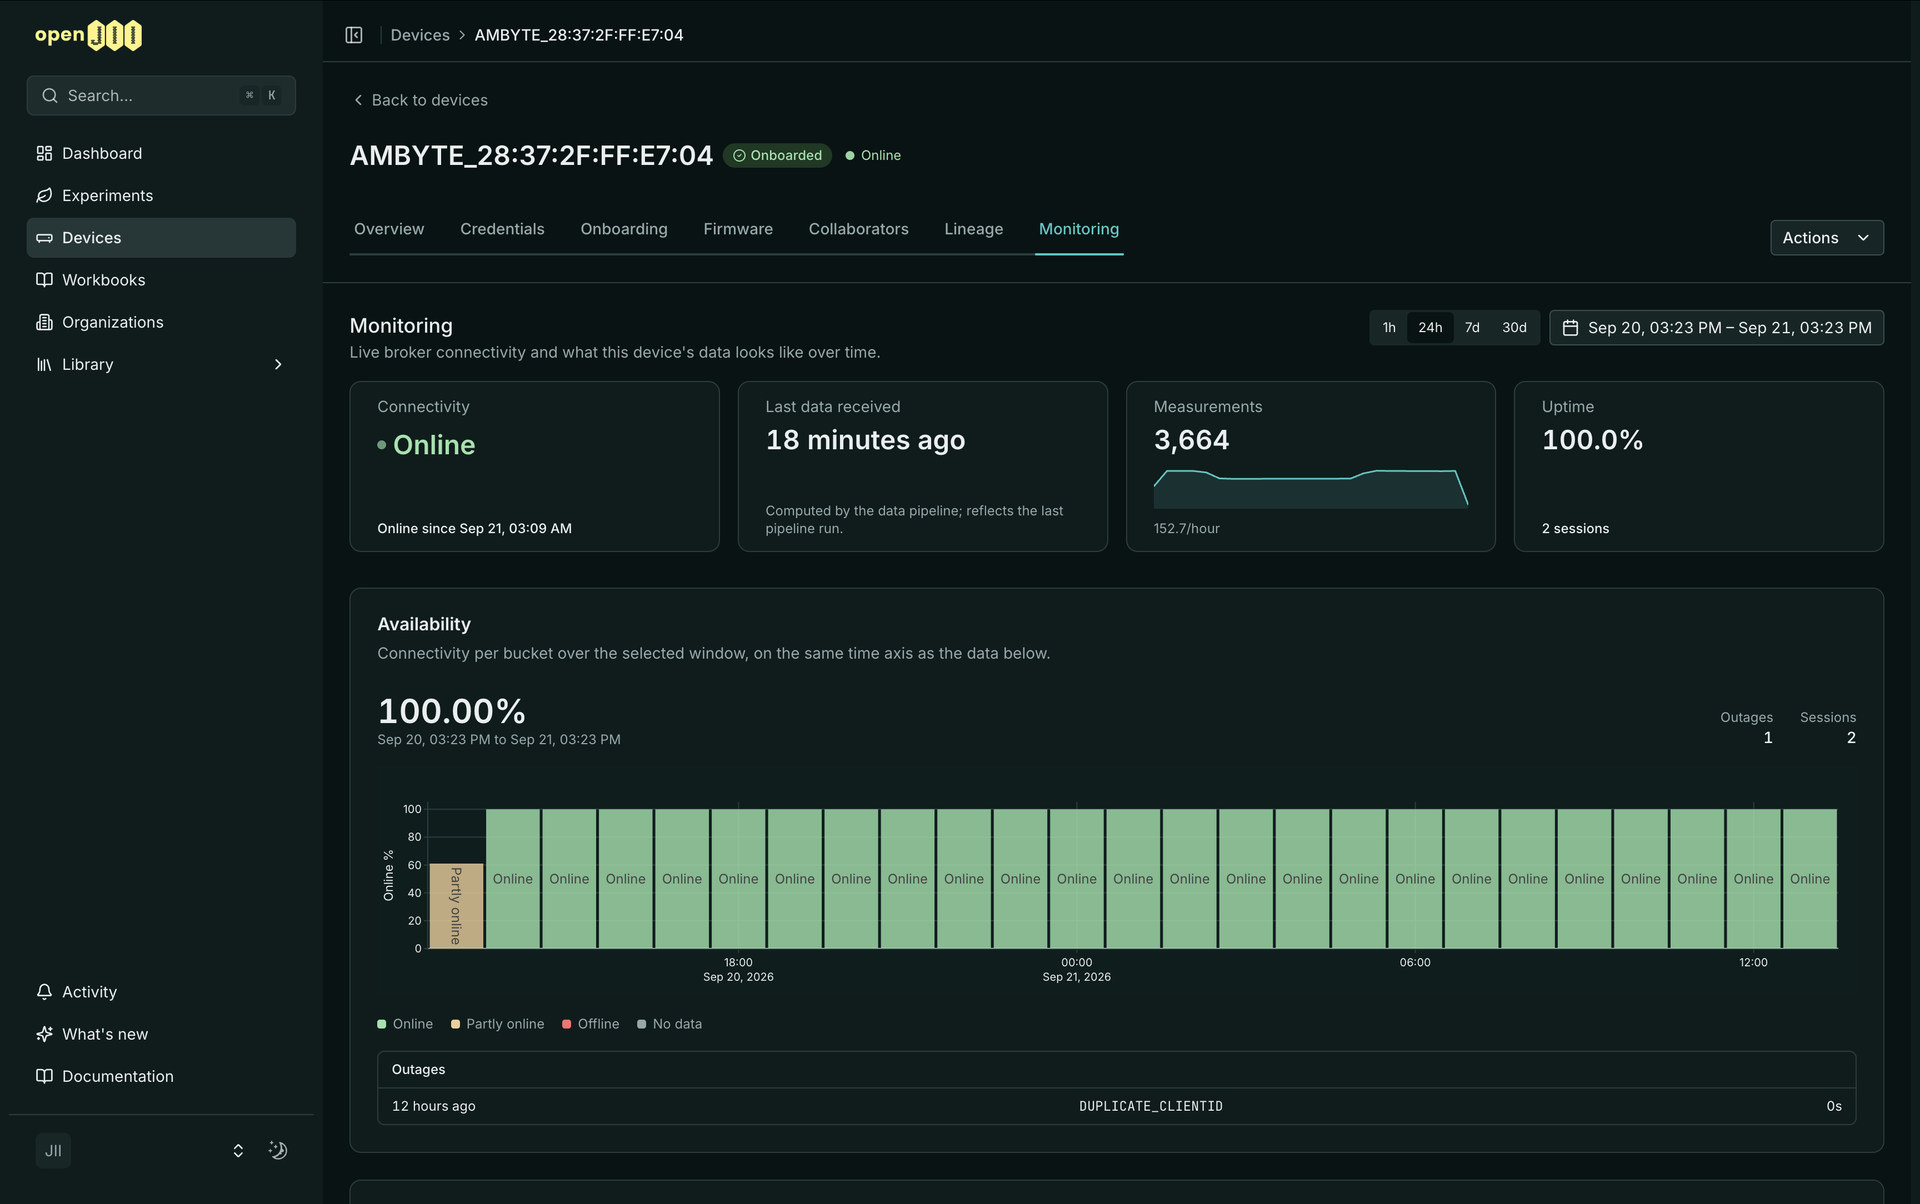
Monitoring covers the last hour through the last thirty days: how reachable the device has been, what arrived, which experiments it reached, its battery and its event log.
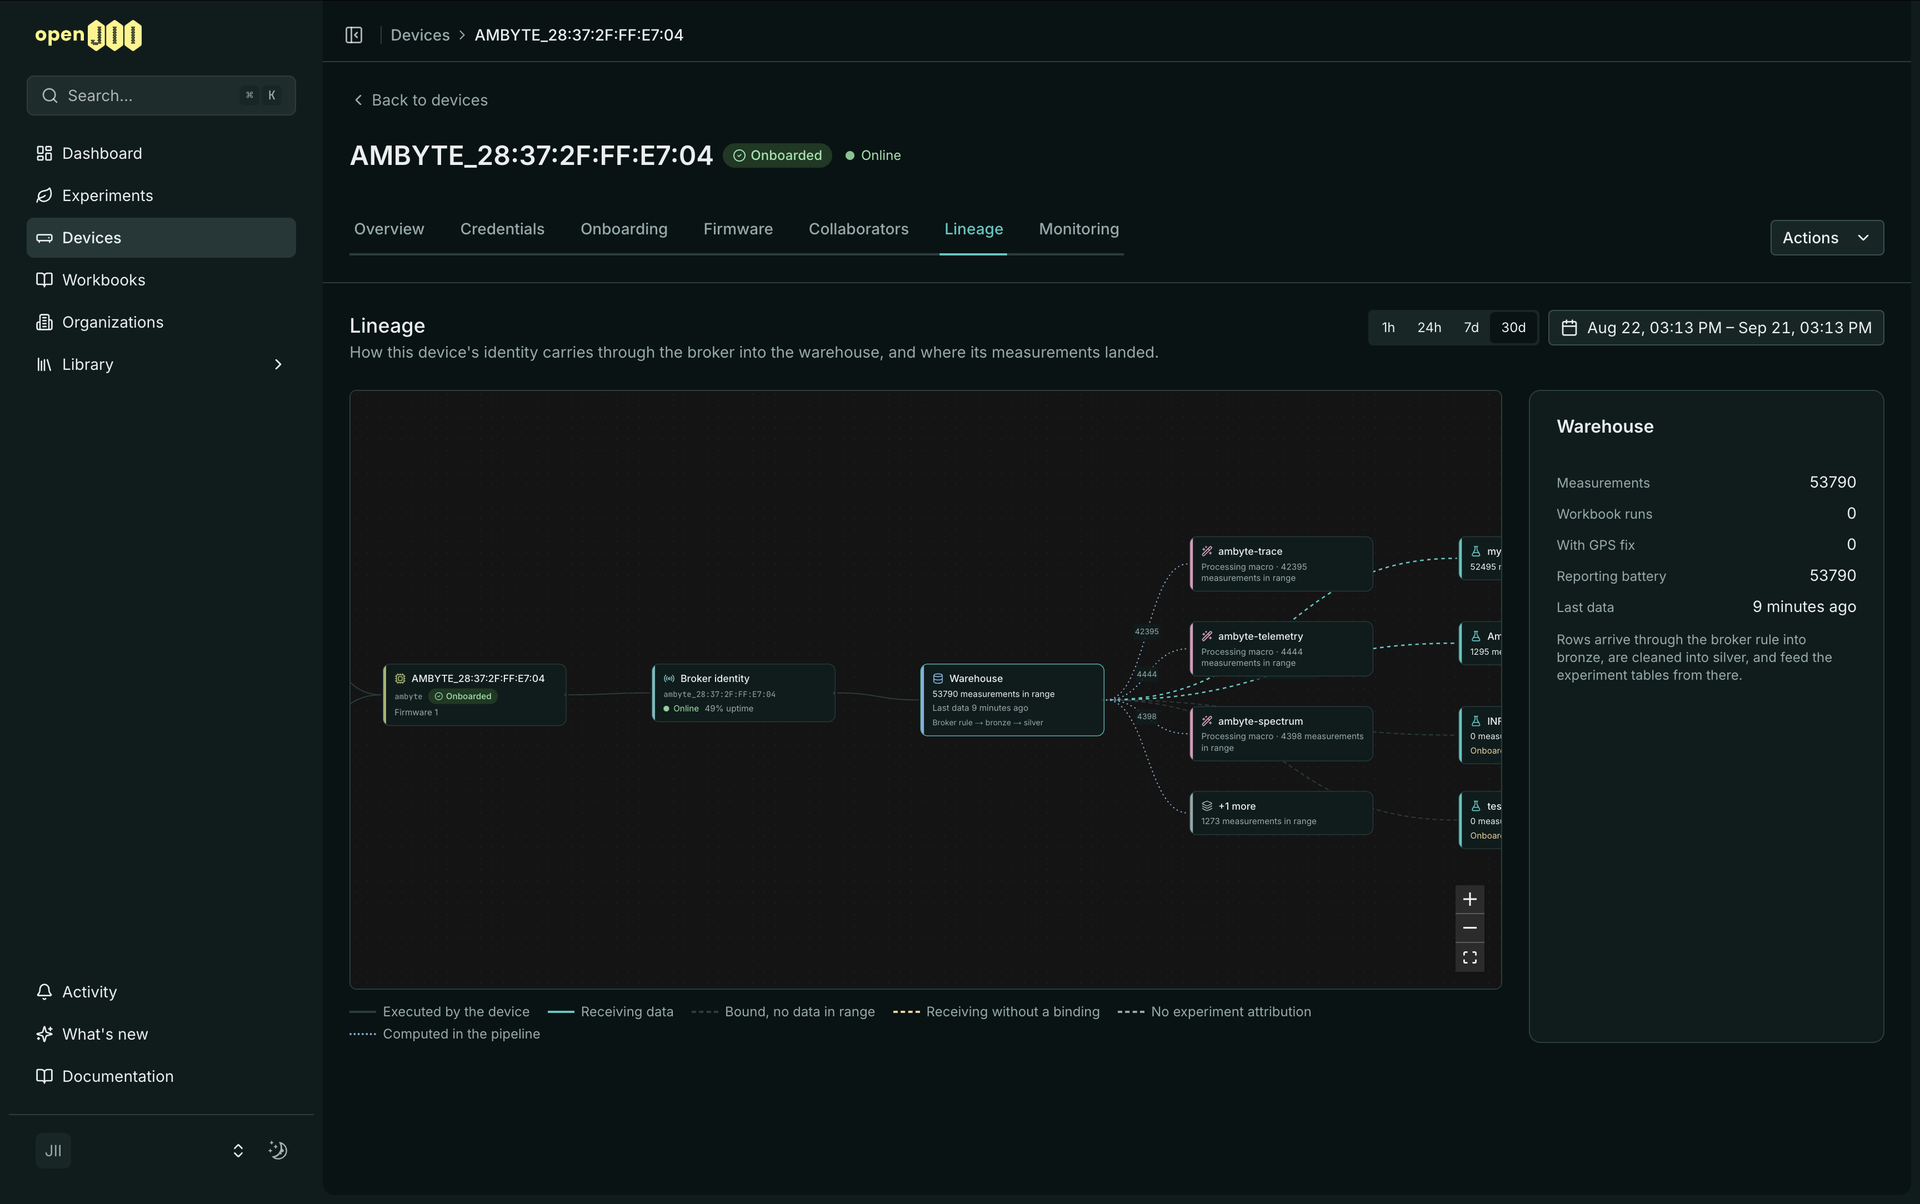
Lineage follows a device's identity from the broker through the warehouse, and shows which tables its measurements finally landed in.
Devices on an experiment
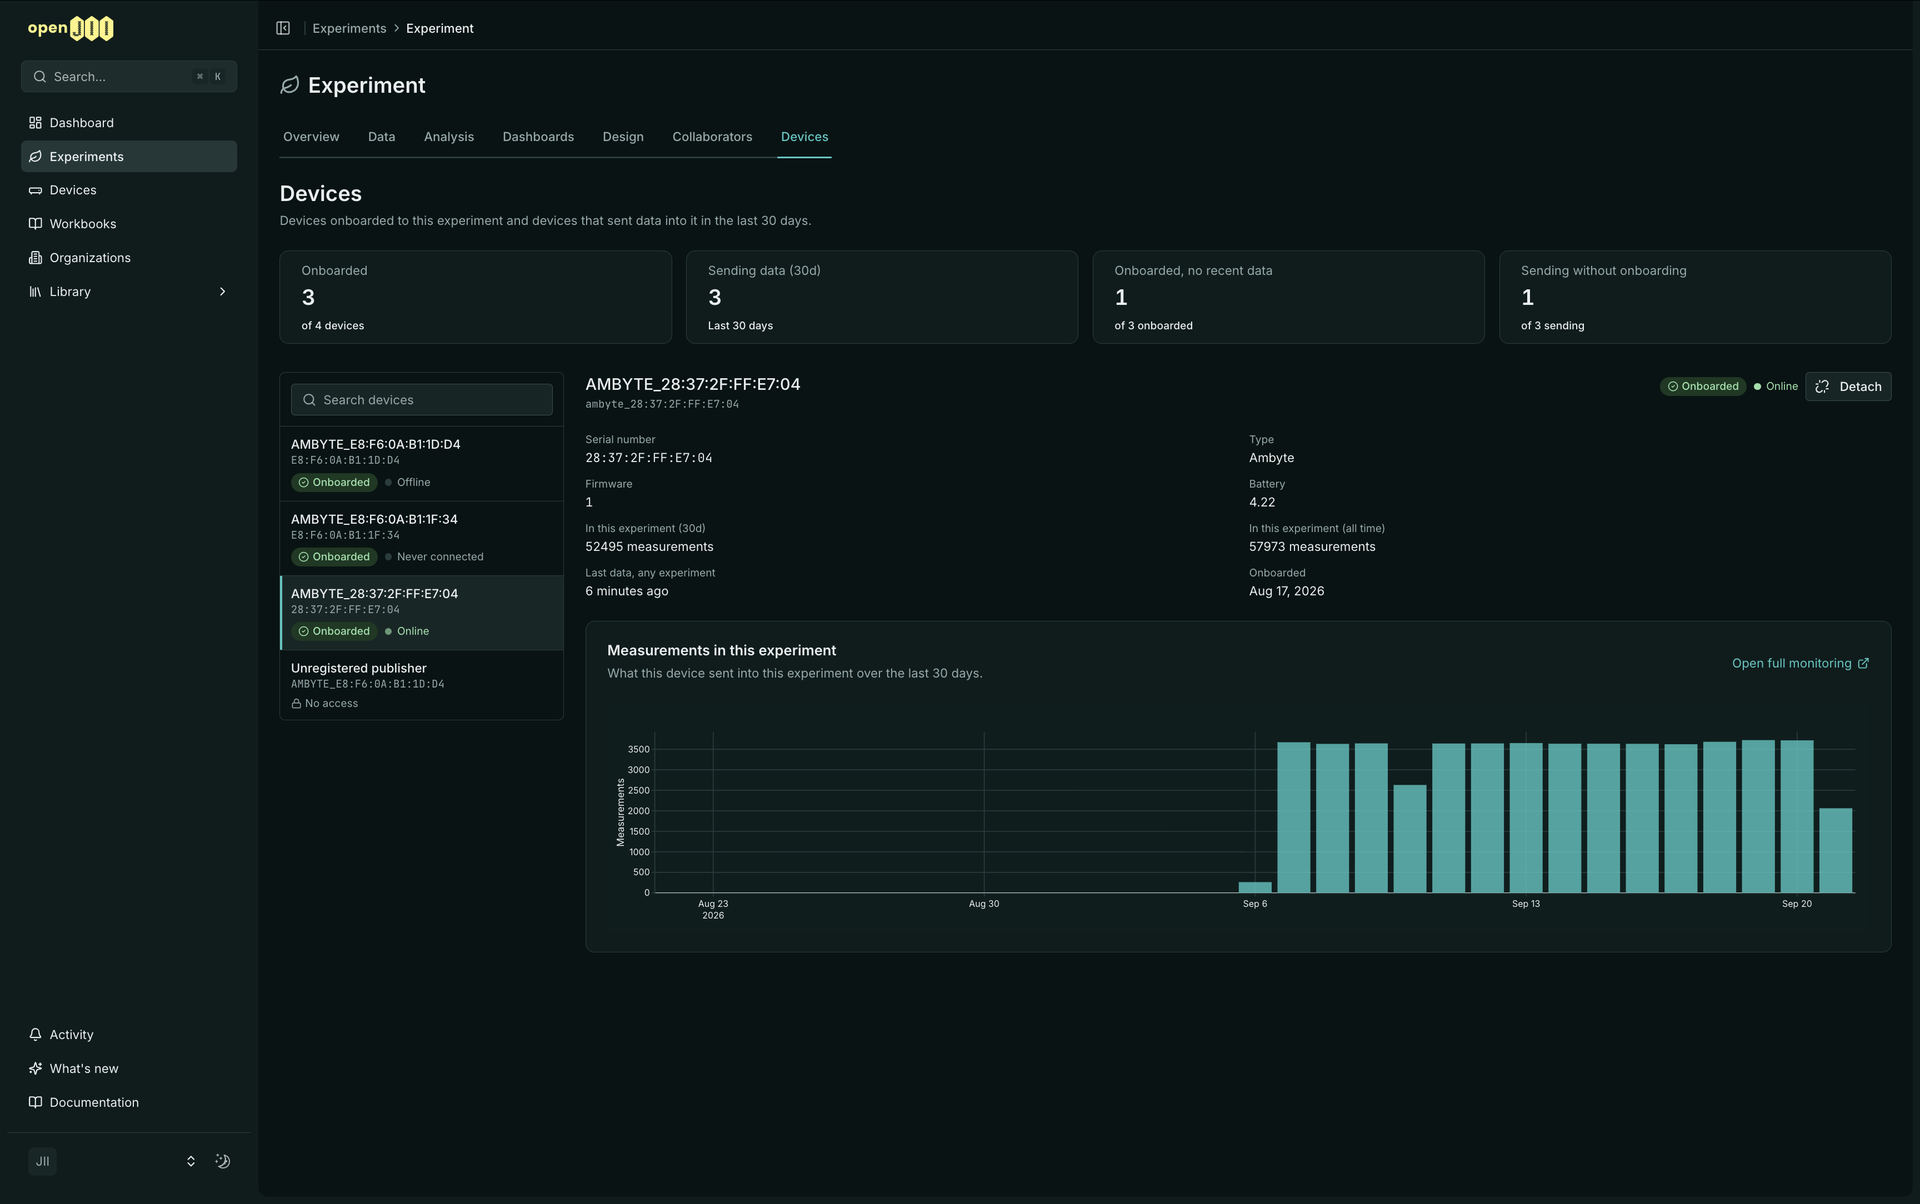
Every experiment has a Devices tab, and you no longer need a role in the owning organization to open it.
It counts what is onboarded, what has sent data in the last thirty days, what is onboarded but silent, and what is publishing into the experiment without being onboarded at all.
Collecting in the field
The Android app moves to 2.65.0, on the Play Store now.
A measurement too large for the usual path uploads over a direct transfer instead of stalling, and a row that still fails tells you what went wrong rather than sitting there unexplained.
You can find an organization and ask to join it from the app, either from your profile or from the card on the home screen.
A connected sensor is identified the moment you plug it in and reports a stable identity, so a measurement carries the instrument that recorded it. The Ambit battery indicator reads correctly again.
A Python macro runs on the Python engine again. Publish a new version of the workbook to pick that up.
The step counter on a recent measurement matches the header of the flow it came from.
A new look, and dark mode
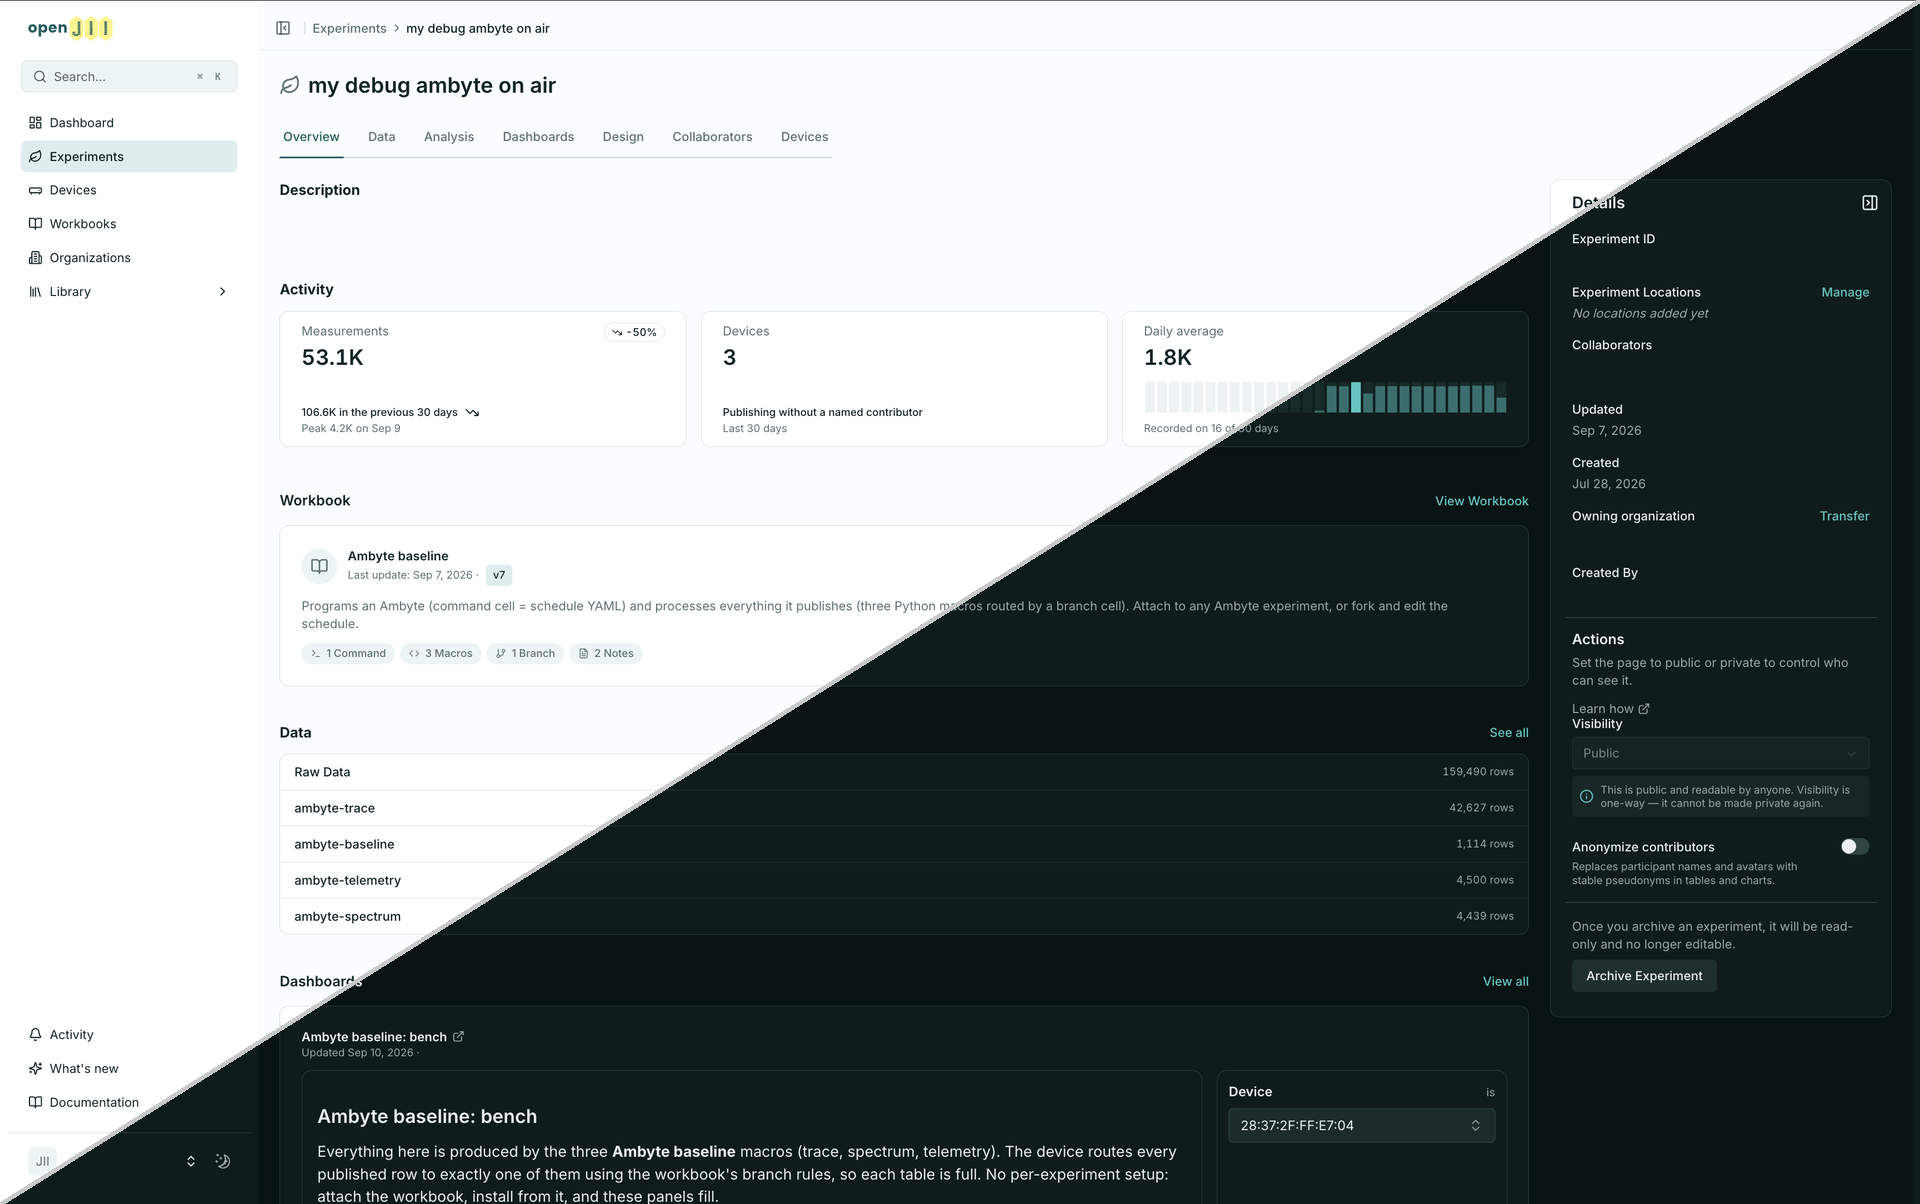
Dark mode is available across the platform and the public site, from a control in the sidebar and in the public header. It follows your system setting the first time you arrive.
A sticky header carries breadcrumbs you can click, and one sidebar now works at every width, getting out of the way when the window is narrow.
Layouts that broke on tablets and narrow windows are repaired, and an expanded dashboard widget fills the screen instead of opening as a small dialog.
The documentation and the public pages picked up the same colours, which shows most in dark mode.
Reading your data
Datasets come from a searchable picker rather than a strip of tabs, grouped as Source, Processed and Uploaded with their row counts.
A chart opens directly beneath the row you clicked, with that row marked, so the table stays in front of you while you read it. Clicking a chart in another row switches to it rather than closing what you had open.
An experiment's overview lists the data it actually holds, table by table, and a table can now show up to a thousand rows at a time.
Exported images carry the openJII mark and follow whichever theme you are in.
Dashboards fetch their visualizations in one request and draw each chart as you scroll to it, so a busy one settles noticeably faster.
The platform's own activity
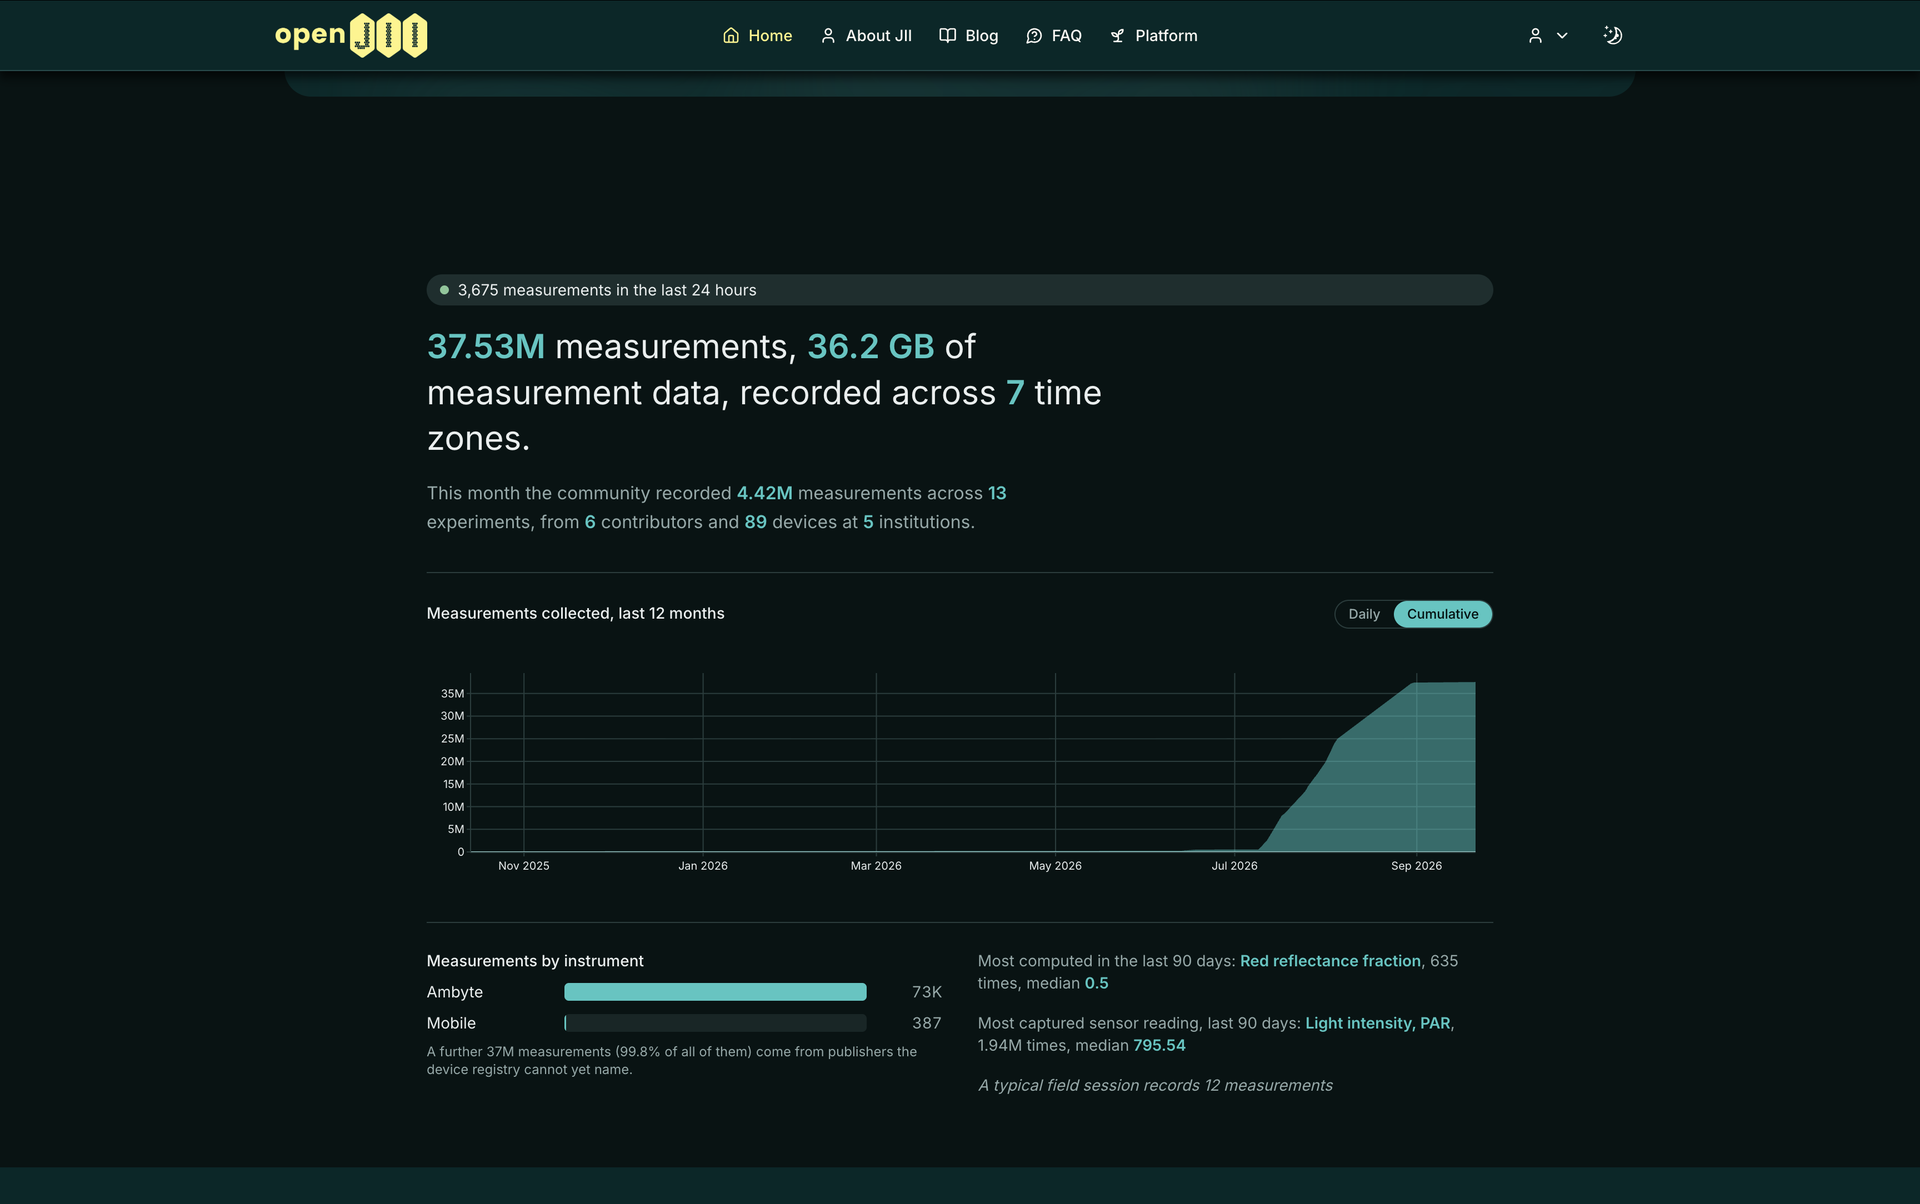
The landing page carries live figures rather than a description: how much has been measured, how much data that is, and how many time zones it spans.
A chart covers the last thirty days and switches to a twelve-month cumulative view, beside a breakdown by instrument and the parameters measured most often.
Signed in, the dashboard opens with a research activity panel, every overview list carries its totals and its busiest resource, and each row carries a small activity trace.
Finding things
Search covers organizations alongside experiments, protocols, macros and workbooks, and returns one ranked list rather than four buckets sorted by type.
Relevance comes first, then your relationship to the thing: your own work ranks above what is shared with you, which ranks above your organization's, which ranks above anything public.
The organizations page is one ranked, searchable table instead of a My and All split.
Open Devices in the platform to register your first instrument, and update the app from the Play Store to pick up this release on your phone.